Cardano price has moved into a local bear market and is at risk of further downside as network activity and social dominance wane.
Cardano (ADA) slumped to $0.668 at last check on Saturday — down by 22% from its highest point in May. It is hovering at its lowest point since May 6.
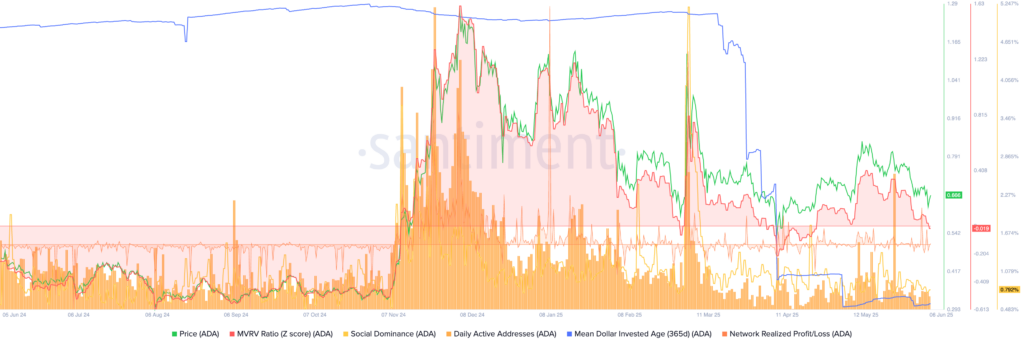
On-chain metrics show that Cardano may be on the verge of more downside. Santiment data shows its social dominance score has moved to 0.792%, down from 1.8% in May. This metric means that fewer people are discussing Cardano on social media platforms like X and Reddit.
Another metric shows that the daily active addresses have fallen in the past few weeks. There were 21,565 addresses on Friday, down from over 60,500 in May, a sign that fewer people are interacting with it.
Further, the closely watched mean dollar invested age (MDIA) has plunged, a sign that old coins are being moved. The 365-day MDIA figure has tumbled to minus 425, down from 62 in September last year.
The network realized profit/loss has moved negative to the negative zone, signaling that buyers have started to capitulate.
Finally, the Market Value to Realized Value or MVRV ratio has turned negative, signaling that Cardano has become a bargain. However, the MVRV ratio of minus 0.019, is higher than it was in April when the coin bounced back.

Apart from on-chain metrics, more data shows that Cardano’s ecosystem is not doing well.
The total value locked in its decentralized finance ecosystem has dropped to $387 million, while the total supply of stablecoins is just $30 million.
These metrics are much lower than Sonic and Unichain, which launched earlier this year.
Cardano price technical analysis

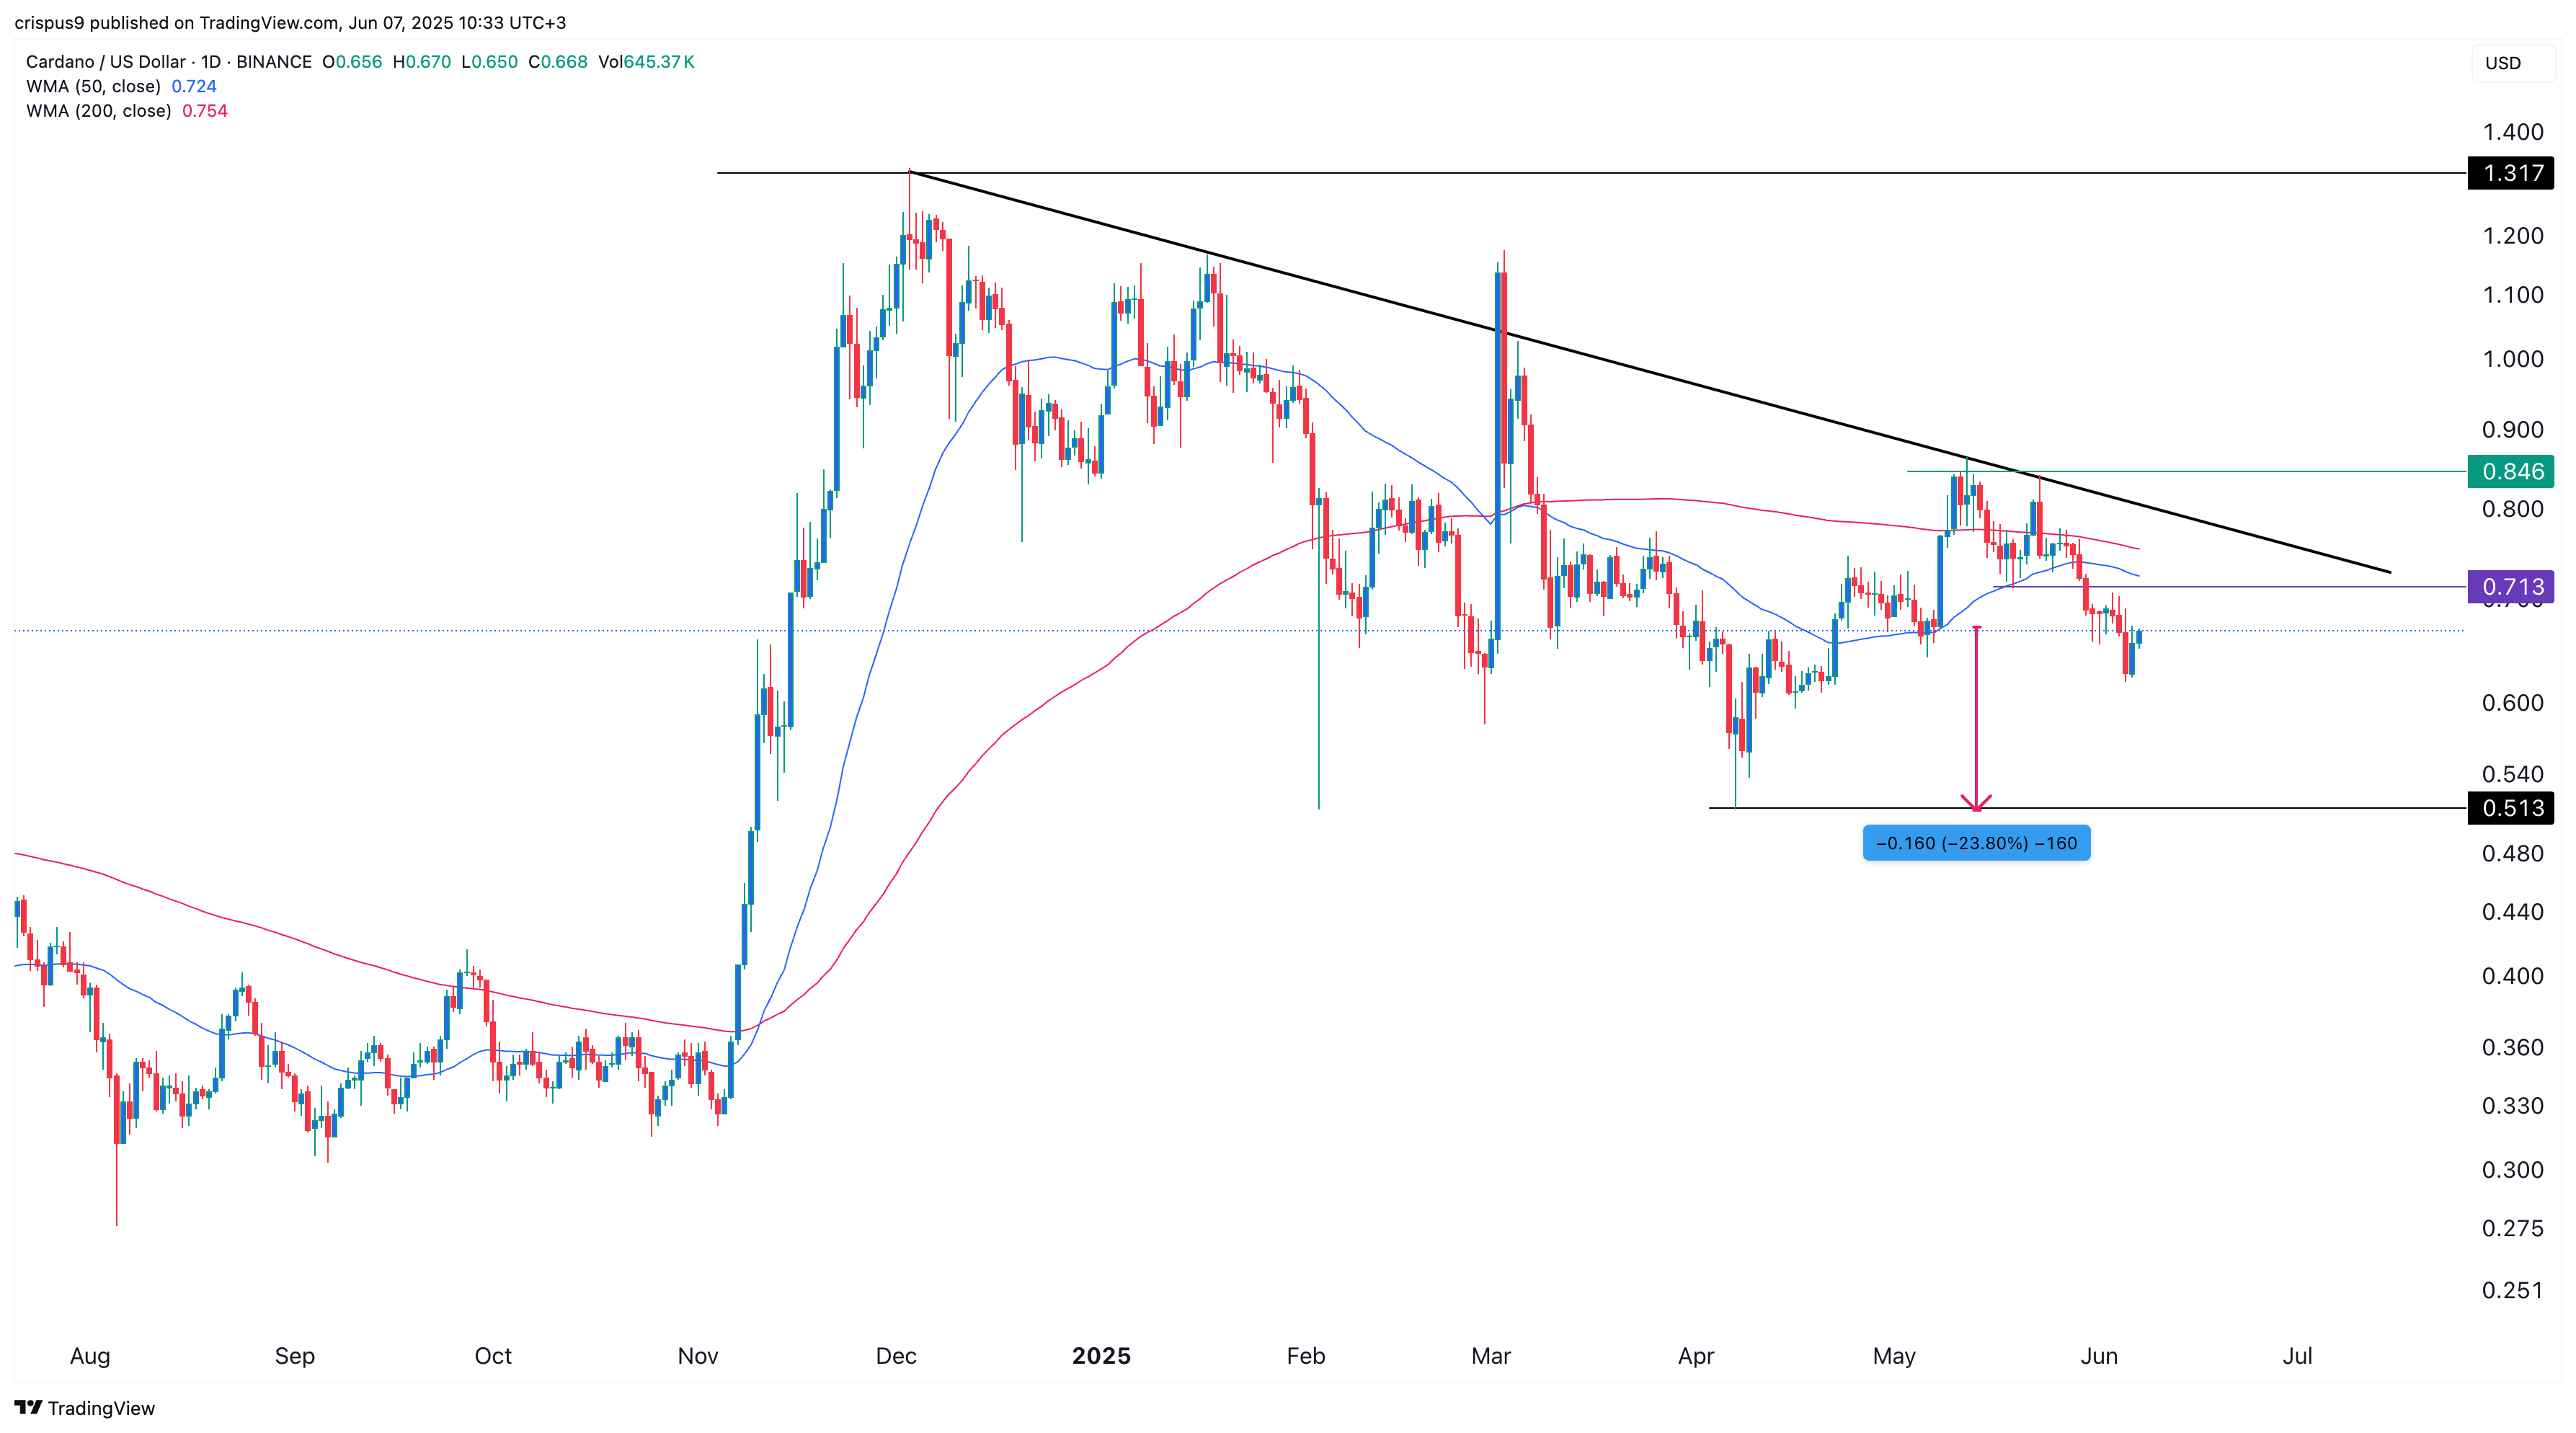
The daily chart shows that the Cardano price has plunged from $1.317 in December to $0.66 today. It has moved below the descending trendline that connects the highest swings since December.
Most recently, it formed a small double-top pattern at $0.845, and has moved below its neckline at $0.713, its lowest point on May 19.
It has also moved below the 50-day and 200-day Weighted Moving Averages. Therefore, the coin will likely continue falling as sellers target the next key support at $0.513, its lowest point in April, down by 23% from the current level.


