


HBAR price remains in a deep bear market after plunging by over 42% from its year-to-date high. This crash could continue after Hedera formed a death cross pattern and as a key metric plunged.
Summary
- HBAR price has formed a death cross pattern on the daily chart.
- The total value locked in Hedera has nosedived this month.
- While stablecoin supply has jumped, there is a risk that it may resume the downtrend.
Hedera (HBAR) token was trading at $0.1767, a range it has held over the past few days. It has jumped by over 77% from its lowest point this year.
Hedera DeFi ecosystem woes continue
The HBAR price could be at risk of a deeper dive as the total value locked in its decentralized finance ecosystem continued falling.
Data compiled by DeFi Llama shows that the total value locked has plunged to $179 million, its lowest level since July 6 this year and well below the year-to-date high of $396 million.
Stader, the top liquid staking network on Hedera, has shed millions, with its TVL falling to $77 million. Similarly, SaucerSwap and Bonzo Finance’s assets have dropped by 13% and 20%, respectively.
Hedera Hashgraph, despite its big name in the crypto industry, has struggled to attract top developers like Aave, Uniswap, and PancakeSwap. As a result, it has been overtaken by newly launched crypto projects like Jupiter Lend, Unichain, and Plasma.
On the positive side, Hedera’s stablecoin supply has jumped by 94% in the last seven days to $170 million. It has jumped to the highest level since August 1, in a sign that users are embracing the technology.
However, stablecoin supply on the network tends to experience significant increases and plunges. The most recent event happened on Sept. 22 when it jumped from $69 million to $164 million on Oct. 2, only to plummet to $69 million a day later.
HBAR price technical analysis
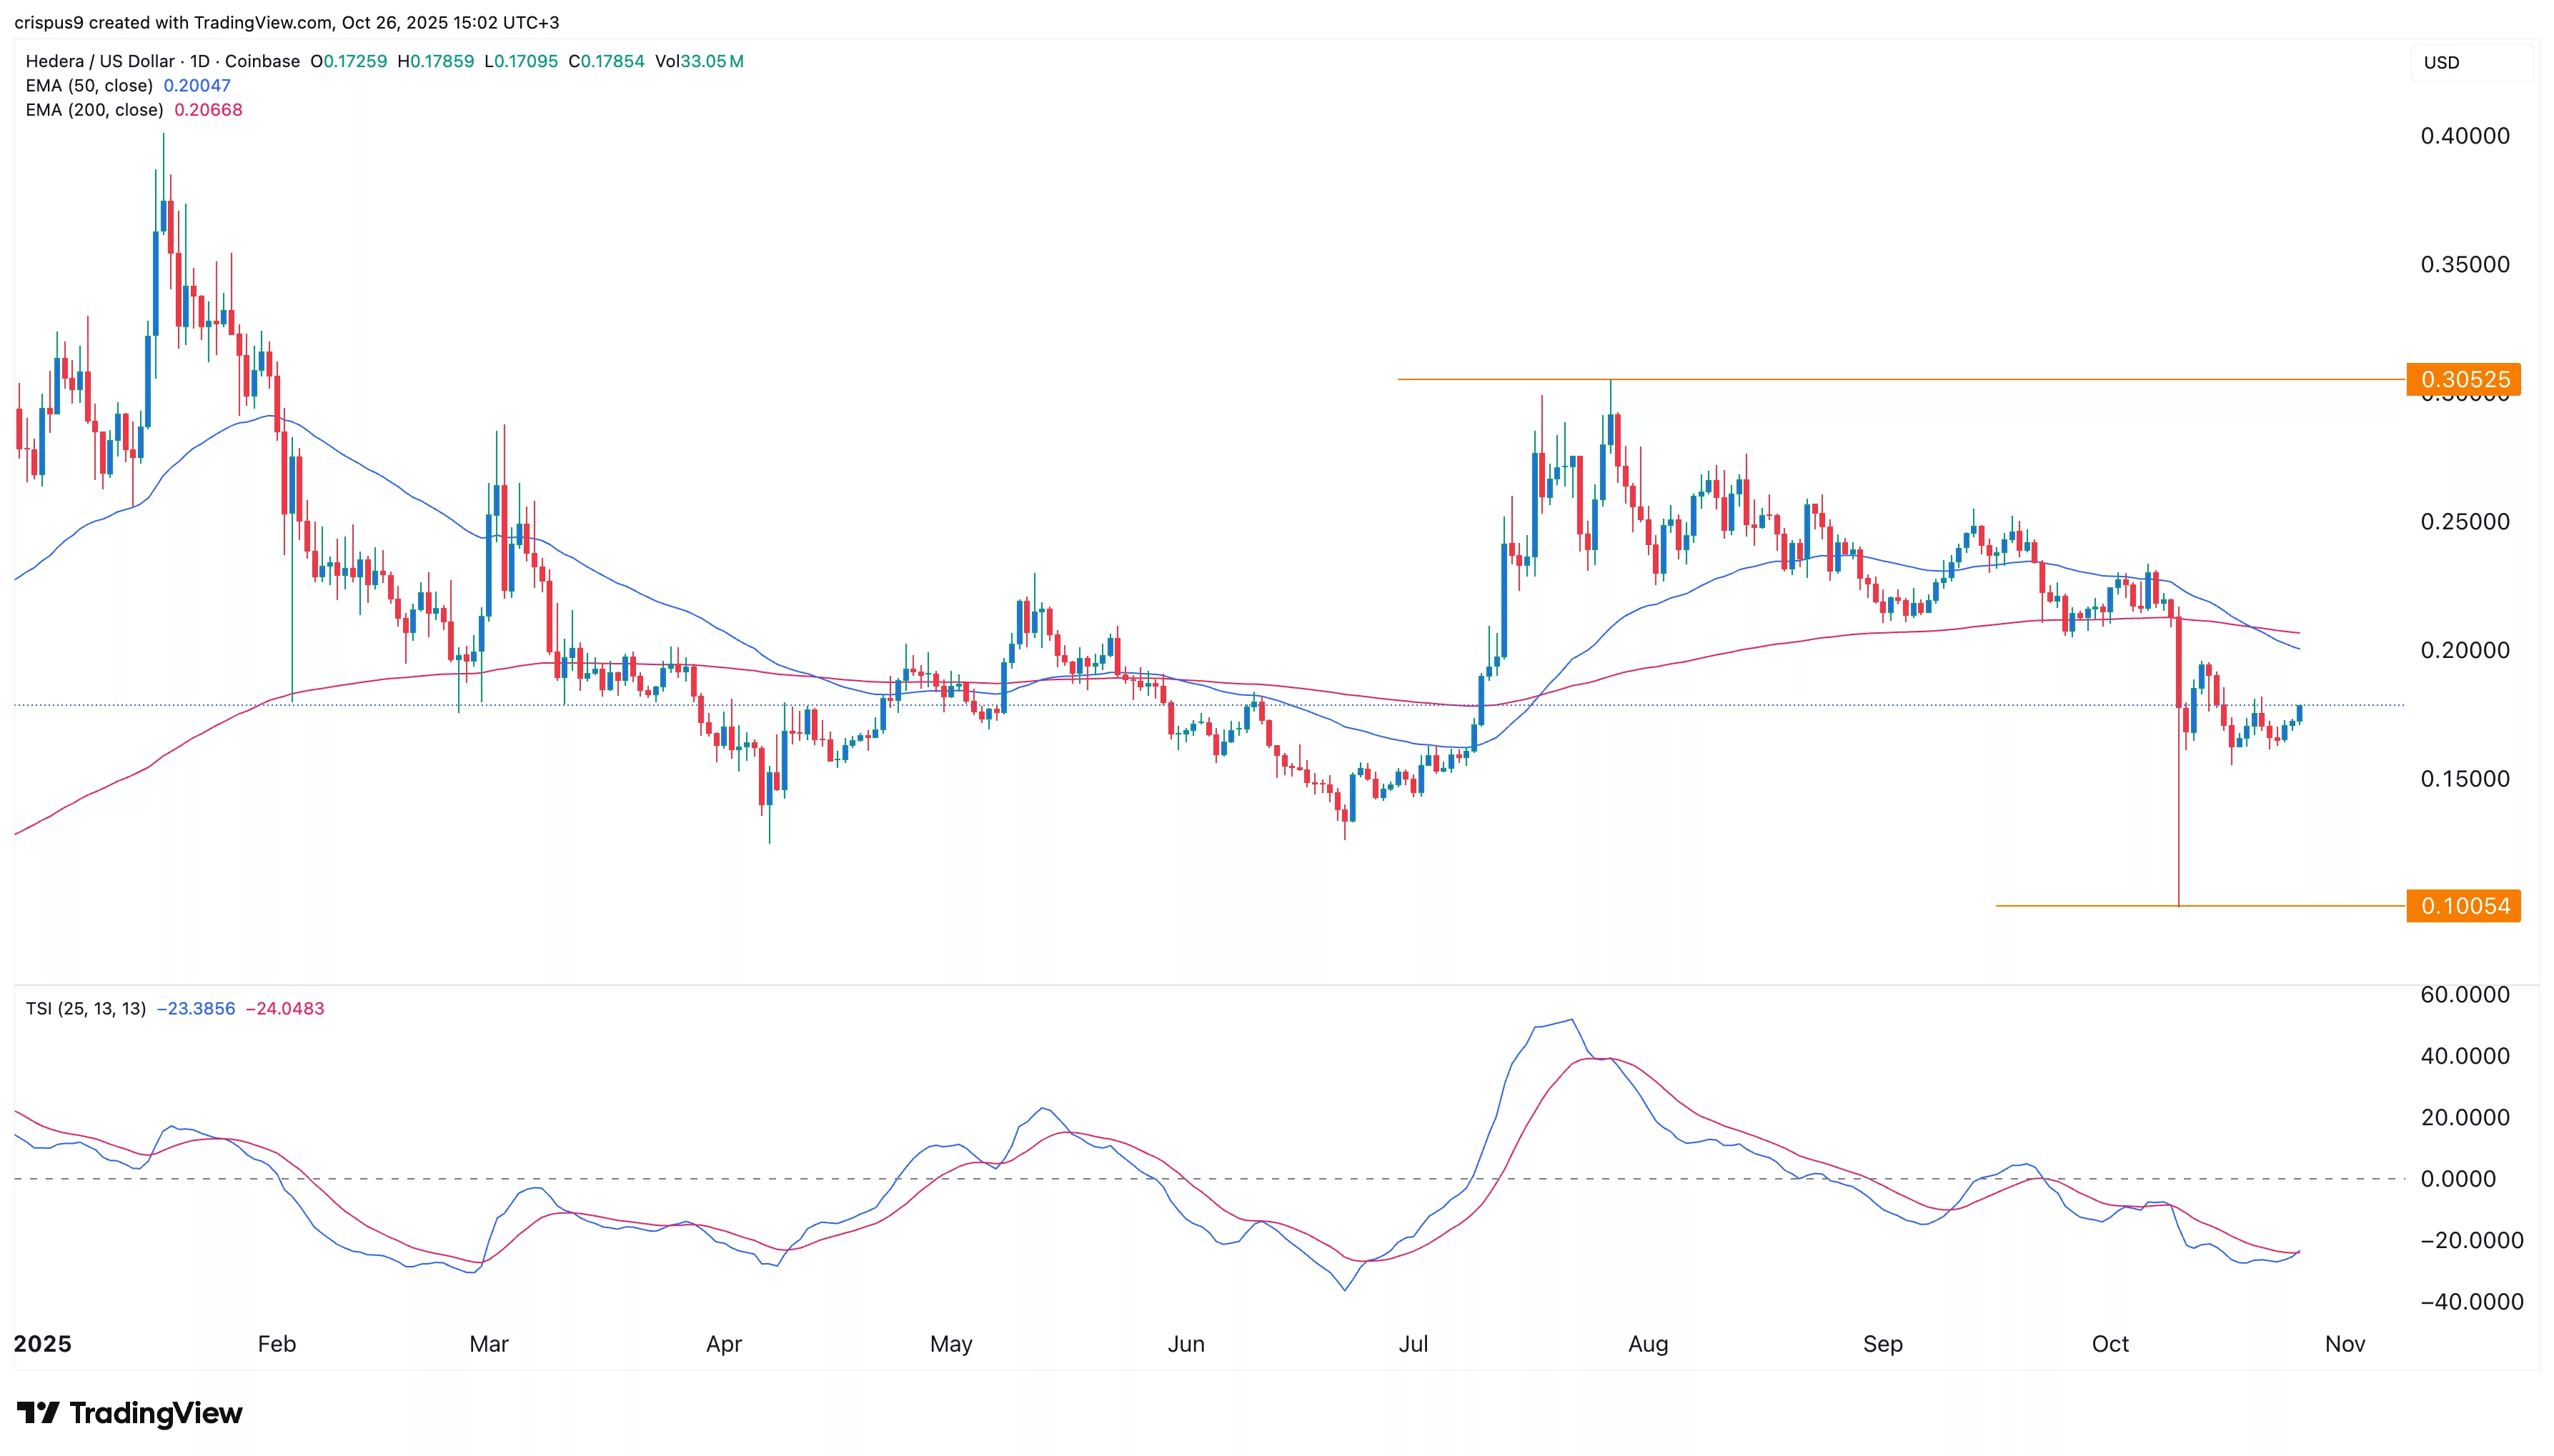
The daily timeframe chart shows that the HBAR price has pulled back in the past few months, moving from a high of $0.3052 in July to $0.1780.
The ongoing recovery is not particularly strong, as evidenced by the falling True Strength Index, whose two lines have continued to drop this month.
The HBAR token price has formed a death cross, as the 50-day moving average has crossed below the 200-day EMA. This pattern, together with the forming bearish pennant, often leads to further downside. In this case, it may crash to the psychological point at $0.15.


