Bitcoin Price Weekly Outlook
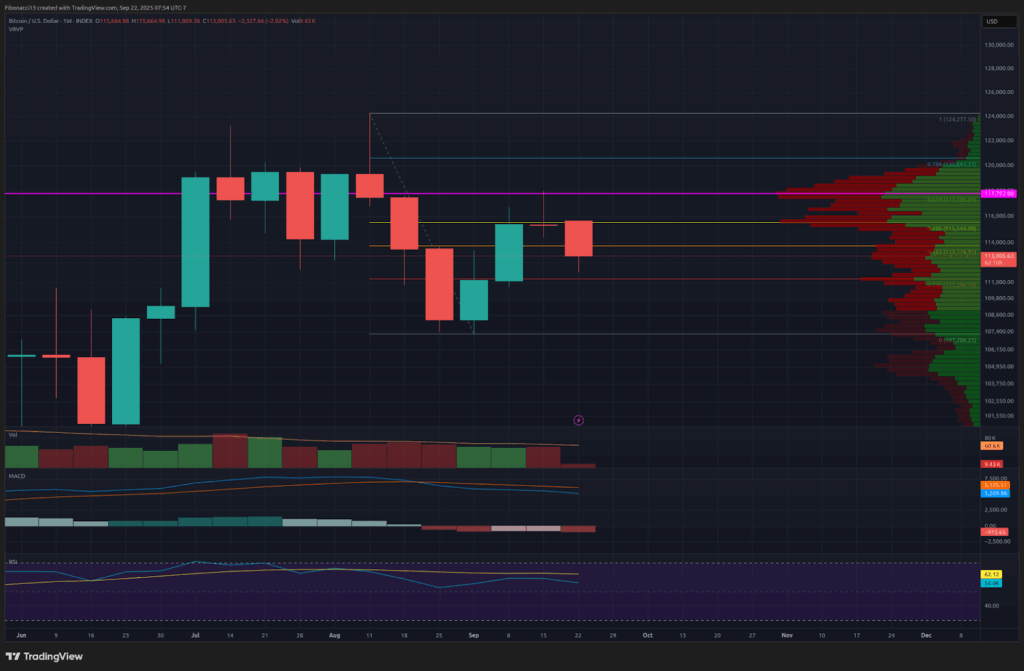
Bitcoin price closed last week at $115,333, rejecting the $118,000 resistance level. After three straight weeks of gains, Bitcoin bulls finally lost steam — and the Fed’s rate cut wasn’t enough to break $118,000.
The U.S. Federal Reserve cut the key interest rate by 25 basis points as anticipated, which provided a boost for markets to close out the week, but it wasn’t enough. Bitcoin price made a move to $118,000 on Thursday after the Fed’s announcement, but was pushed back just shy of this critical resistance level. Sunday’s close gave us a shooting star doji candle for the week, signaling a likely reversal in price action heading into this week. The bears have finally stepped in to limit bitcoin’s gains after a 3-week rally by the bulls. We may see some renewed strength by the bears this week as they attempt to push the price down to test the recent support levels.

Key Support and Resistance Levels Now
Looking downward, we are eyeing the $111,300 level as a potential support level. Bitcoin nearly hit that support level already after the big sell-off Sunday night. Below a bitcoin price of $111,300, we will once again look to the 21 EMA, which is currently at $109,500, entering this week. If the price closes below the 21 EMA, it is unlikely the $107,000 low will hold, and we should look to the $105,000 level to act as support.
Price crashed straight through the $113,800 support level on Sunday night, but we will look for bitcoin to close above this level to give some renewed strength to the bulls this week. The next resistance level above here is $115,500. If we can manage to establish these levels as support, we will look to make another attempt at the critical $118,000 resistance level.
Outlook For This Week
Bitcoin saw a massive sell-off just after the weekly close on Sunday night, which brought the bitcoin price all the way down to $111,800.
There are two ways to view this action. Rapid price corrections like this often occur in bullish environments, so it is possible the low this week is already in, and we could expect to see more bullish price action through the remainder of this week. The other possibility is that this is just the beginning of a renewed downtrend, in which case we would anticipate a slight bounce from the lows over the next day or so, followed by continued bearish price action to close out the week. So, to maintain bullish bias this week, we want to see price regain the $113,800 level, while the bears will attempt to push price down past the $111,300 support level to maintain bearish bias.
Market mood: Bearish — after rejecting $118,000 with a shooting-star doji candle, the bears are back in control for the time being.
The Next Few Weeks
Expanding our view on bitcoin price action into the next few weeks, we will look to establish a higher low on the weekly chart. If we can get any type of reversal before the price gets down to the $107,000 low, the bulls will get this higher low and will look to take over once again from the bears.
The MACD oscillator is still in a slightly bearish position after crossing bearish at the end of August. This should assist the bears in keeping the price subdued while it is in place. Bulls will be looking for the MACD to cross back bullish in the coming weeks to give them a bit more strength and help to overcome the $118,000 resistance level.
Terminology Guide:
Bulls/Bullish: Buyers or investors expecting the price to go higher.
Bears/Bearish: Sellers or investors expecting the price to go lower.
Support or support level: A level at which the price should hold for the asset, at least initially. The more touches on support, the weaker it gets and the more likely it is to fail to hold the price.
Resistance or resistance level: Opposite of support. The level that is likely to reject the price, at least initially. The more touches at resistance, the weaker it gets and the more likely it is to fail to hold back the price.
EMA: Exponential Moving Average. A moving average that applies more weight to recent prices than earlier prices, reducing the lag of the moving average.
Oscillators: Technical indicators that vary over time, but typically remain within a band between set levels. Thus, they oscillate between a low level (typically representing oversold conditions) and a high level (typically representing overbought conditions). E.G., Relative Strength Index (RSI) and Moving Average Convergence-Divergence (MACD).
MACD Oscillator: Moving Average Convergence-Divergence is a momentum oscillator that subtracts the difference between two moving averages to indicate trend as well as momentum.


