


Solana stayed locked in a tight range between $117.3 and $128.8 on December 19. The price action pointed to caution. Traders showed little urgency to take strong positions.
The market is coming off months of sharp moves. Those swings left many participants waiting for clearer signals.
A key question is now taking shape. Has SOL started to build a real base, or is this just another pause?
DISCOVER: Top Solana Meme Coins to Buy in 2025
Is Solana’s Price Being Driven More by Spot Buyers or Derivatives Traders?
With the final weeks of 2025 ahead, technical levels are drawing more attention. These zones are likely to guide short-term direction and shape how traders position going forward.
The next major move may hinge on a balance issue. Spot buyers are stepping in, but the derivatives market remains active and aggressive.
That tension continues to define price behavior. The recent bounce came alongside solid participation. Trading volume reached about $6.0Bn over 24 hours. Solana’s market capitalization sits near $70.9Bn, keeping it among the largest tokens in the market.
Derivatives positioning adds another layer to the picture. Data from DefiLlama shows around $1.497Bn in 24-hour perpetual volume on Solana-linked venues, with open interest near $365M.
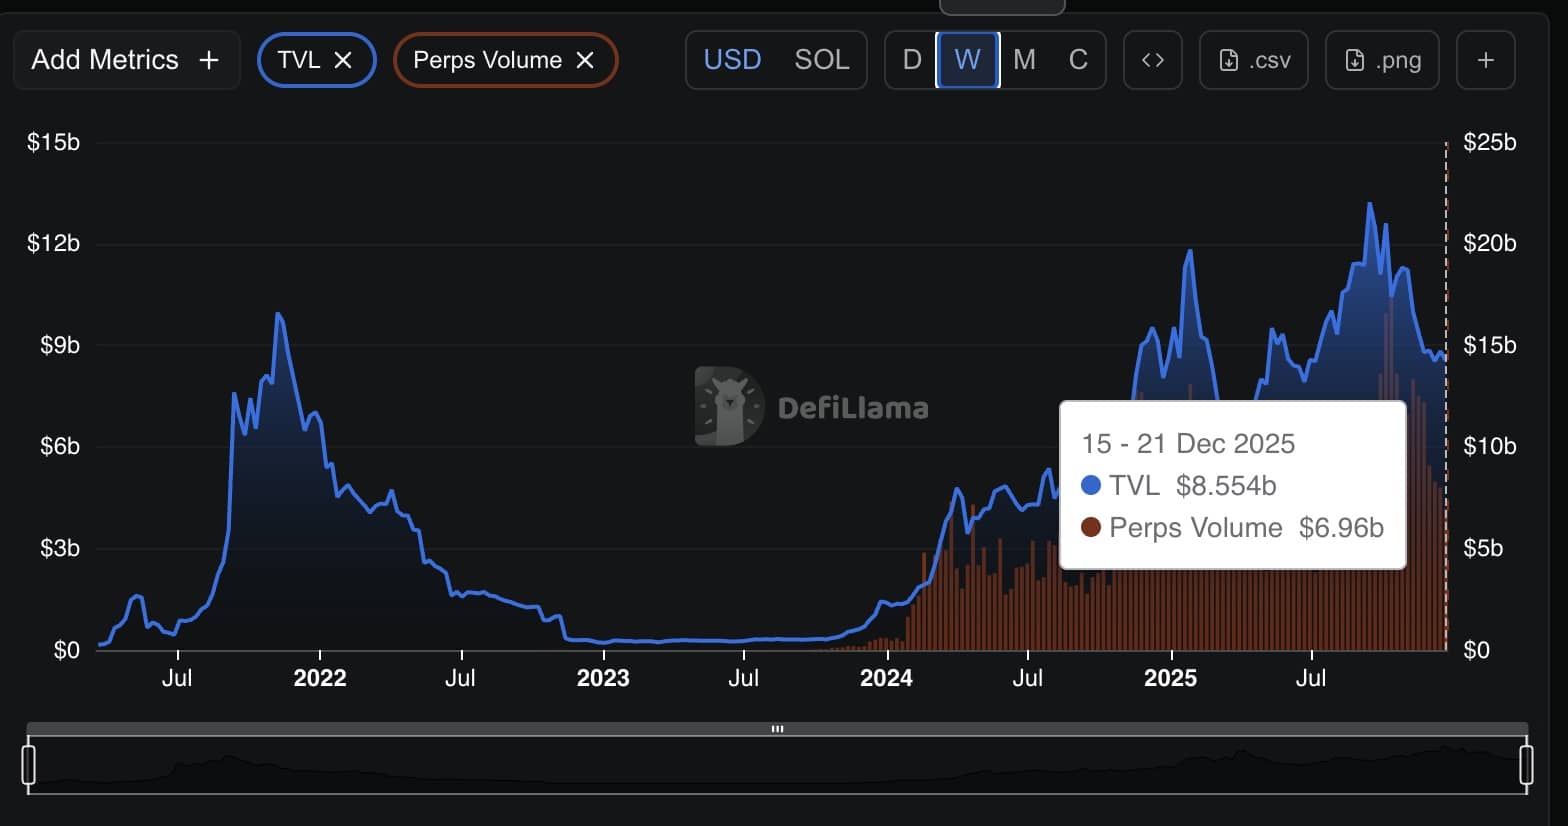
Over the past 30 days, total perp volume sits close to $39.8Bn.
DISCOVER: 16+ New and Upcoming Binance Listings in 2025
Solana Price Prediction: What Does SOL’s Bullish RSI Divergence Signal Near Long-Term Support?
That activity suggests traders are still using leverage to play short-term moves, even as the spot price tries to hold above the session low.
On the chart, Solana is testing a level that traders have tracked for nearly two years. Price is compressing near a clear support zone on higher timeframes.
On the three-day chart, SOL has pulled back in an orderly way from its late-2025 highs and is now moving sideways around the same area that acted as a base during earlier corrections.
The structure shows lower highs pressing into support. But selling pressure looks lighter. Each dip has drawn quick responses, which points to active buyers in this range.
For now, the market remains within a broader range, not a confirmed breakdown, with this support acting as a key balance point.
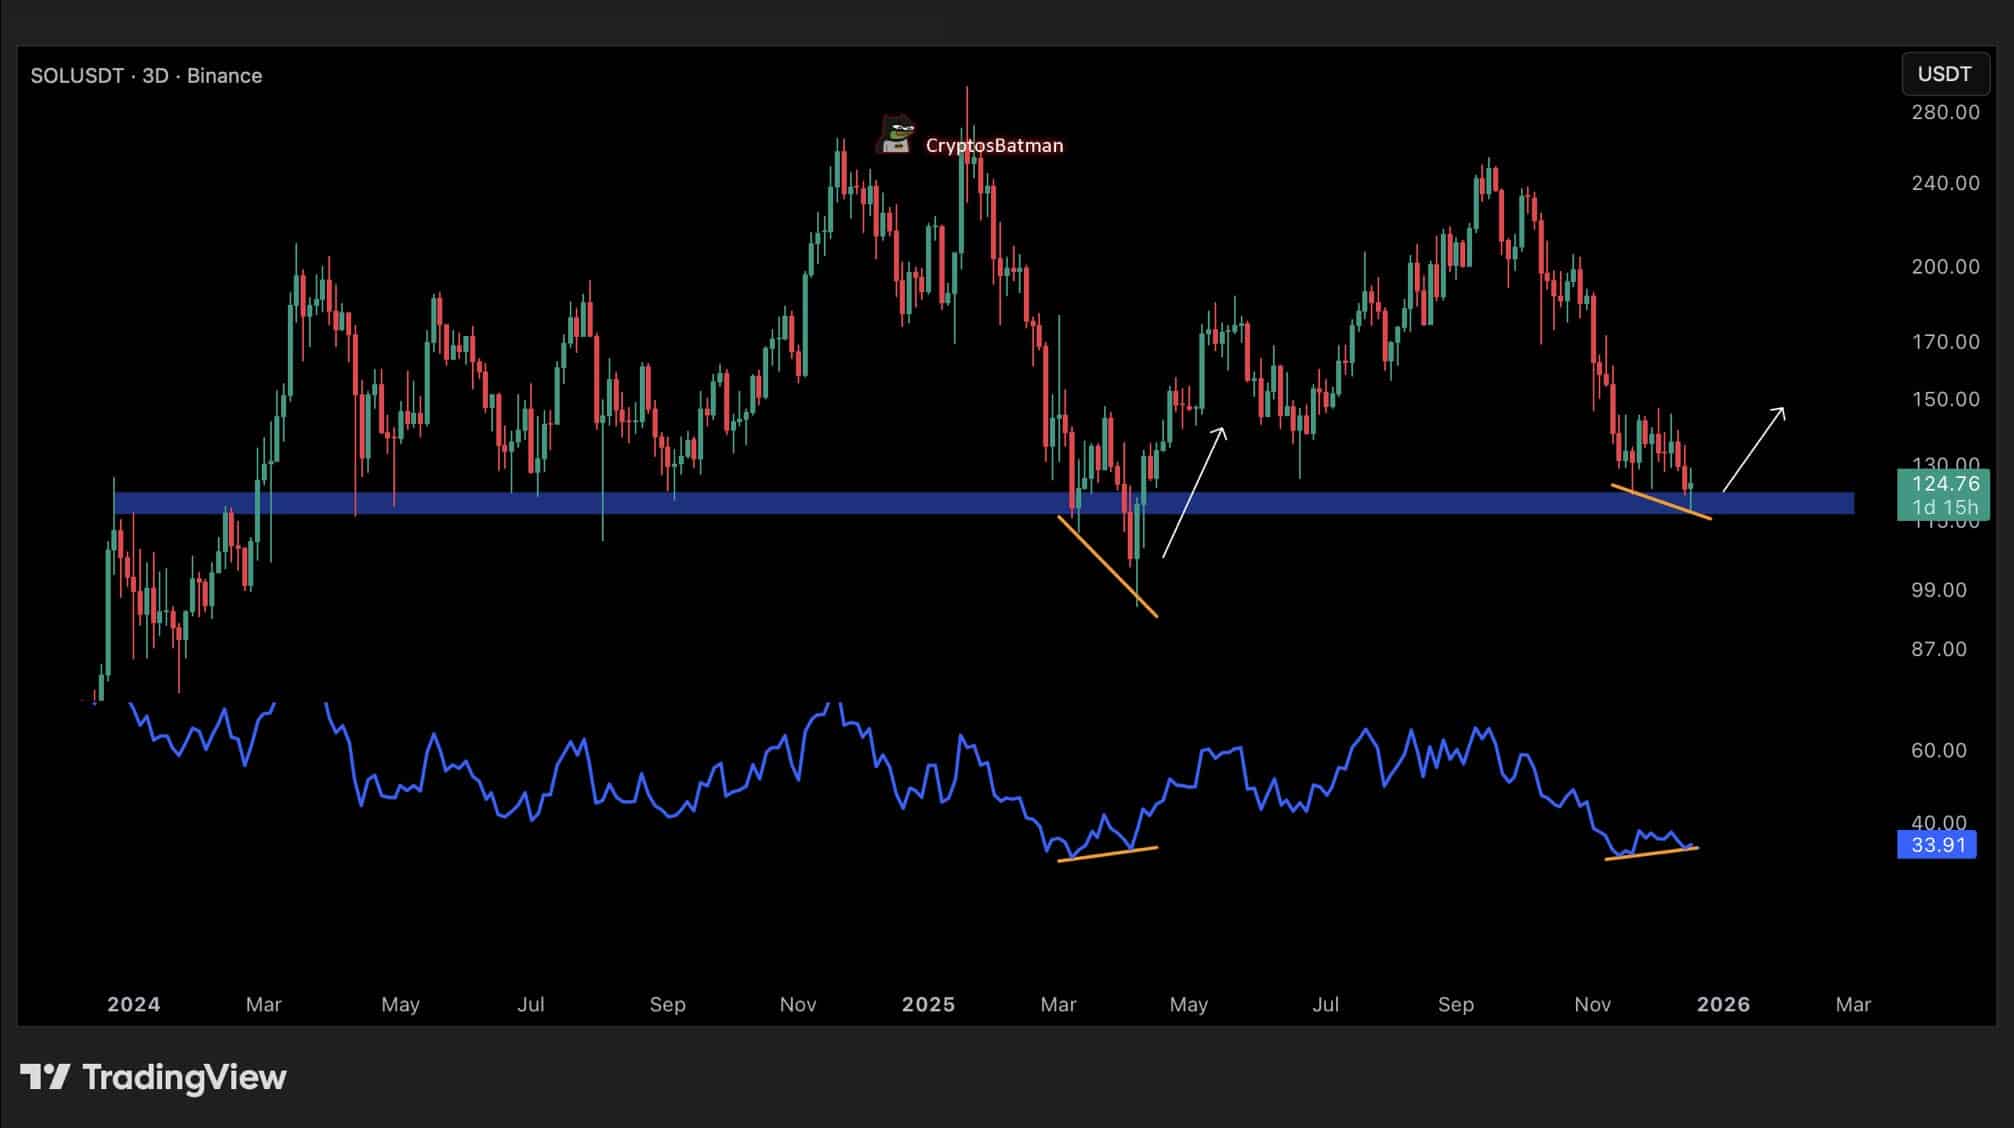
Momentum indicators point to a shift beneath the surface. On the 3-day chart, the RSI is showing a bullish divergence.
The indicator is forming higher lows while the price continues to test the same support zone. That usually signals that selling pressure is losing strength.
A similar pattern appeared earlier in the cycle, just before the March bottom.
The analyst highlighted the parallel in his commentary. “$SOL is not only at its major support level, the same one that has held price for the past two years, but there’s also a bullish divergence forming on the 3D timeframe,” he said.
He added that the current setup closely matches what played out ahead of the previous major low in March.
Together, the repeated support tests and improving momentum suggest downside pressure may be weakening, even though the price has yet to break higher.
DISCOVER: 10+ Next Crypto to 100X In 2025
The post SOL Holds Tight Range as Support Gets Tested: Base Formation or False Calm? appeared first on 99Bitcoins.


