


XRP price has traded near $1.50 on Sep. 30 as weaker futures positioning and slower U.S. ETF inflows accompany a pullback from September’s highs, while its 4-hour chart shows buyers struggling to reclaim short-term resistance.
Summary
- $1.5625 marks daily resistance, while $1.4648 is the nearest lower level on the XRP daily chart.
- XRP’s 4-hour RSI stands at 47.29, slightly above its signal line but below 50.
- Futures open interest fell about $270 million from Sep. 28, according to CoinGlass data.
- Analysts CW and Wealthmanager pointed to renewed spot buying and a conditional bullish setup.
TradingView’s Binance XRP/USDT charts put the token at approximately $1.498–$1.499. XRP remains below its late-September peak near $1.65, with recent trading concentrated around the $1.50 level after several unsuccessful attempts to sustain a rebound.
The retreat has brought XRP back toward a price zone that analyst Wealthmanager identifies as support following its September advance. Meanwhile, CoinGlass’s liquidation heatmap shows larger concentrations of potential liquidations above the market, particularly around $1.55–$1.57 and $1.59.
XRP needs to reclaim $1.503 before testing resistance
On TradingView’s 4-hour chart, XRP trades just below the Bollinger Bands’ middle line at $1.5031. The upper band stands at $1.5355, while the lower band sits at $1.4707.
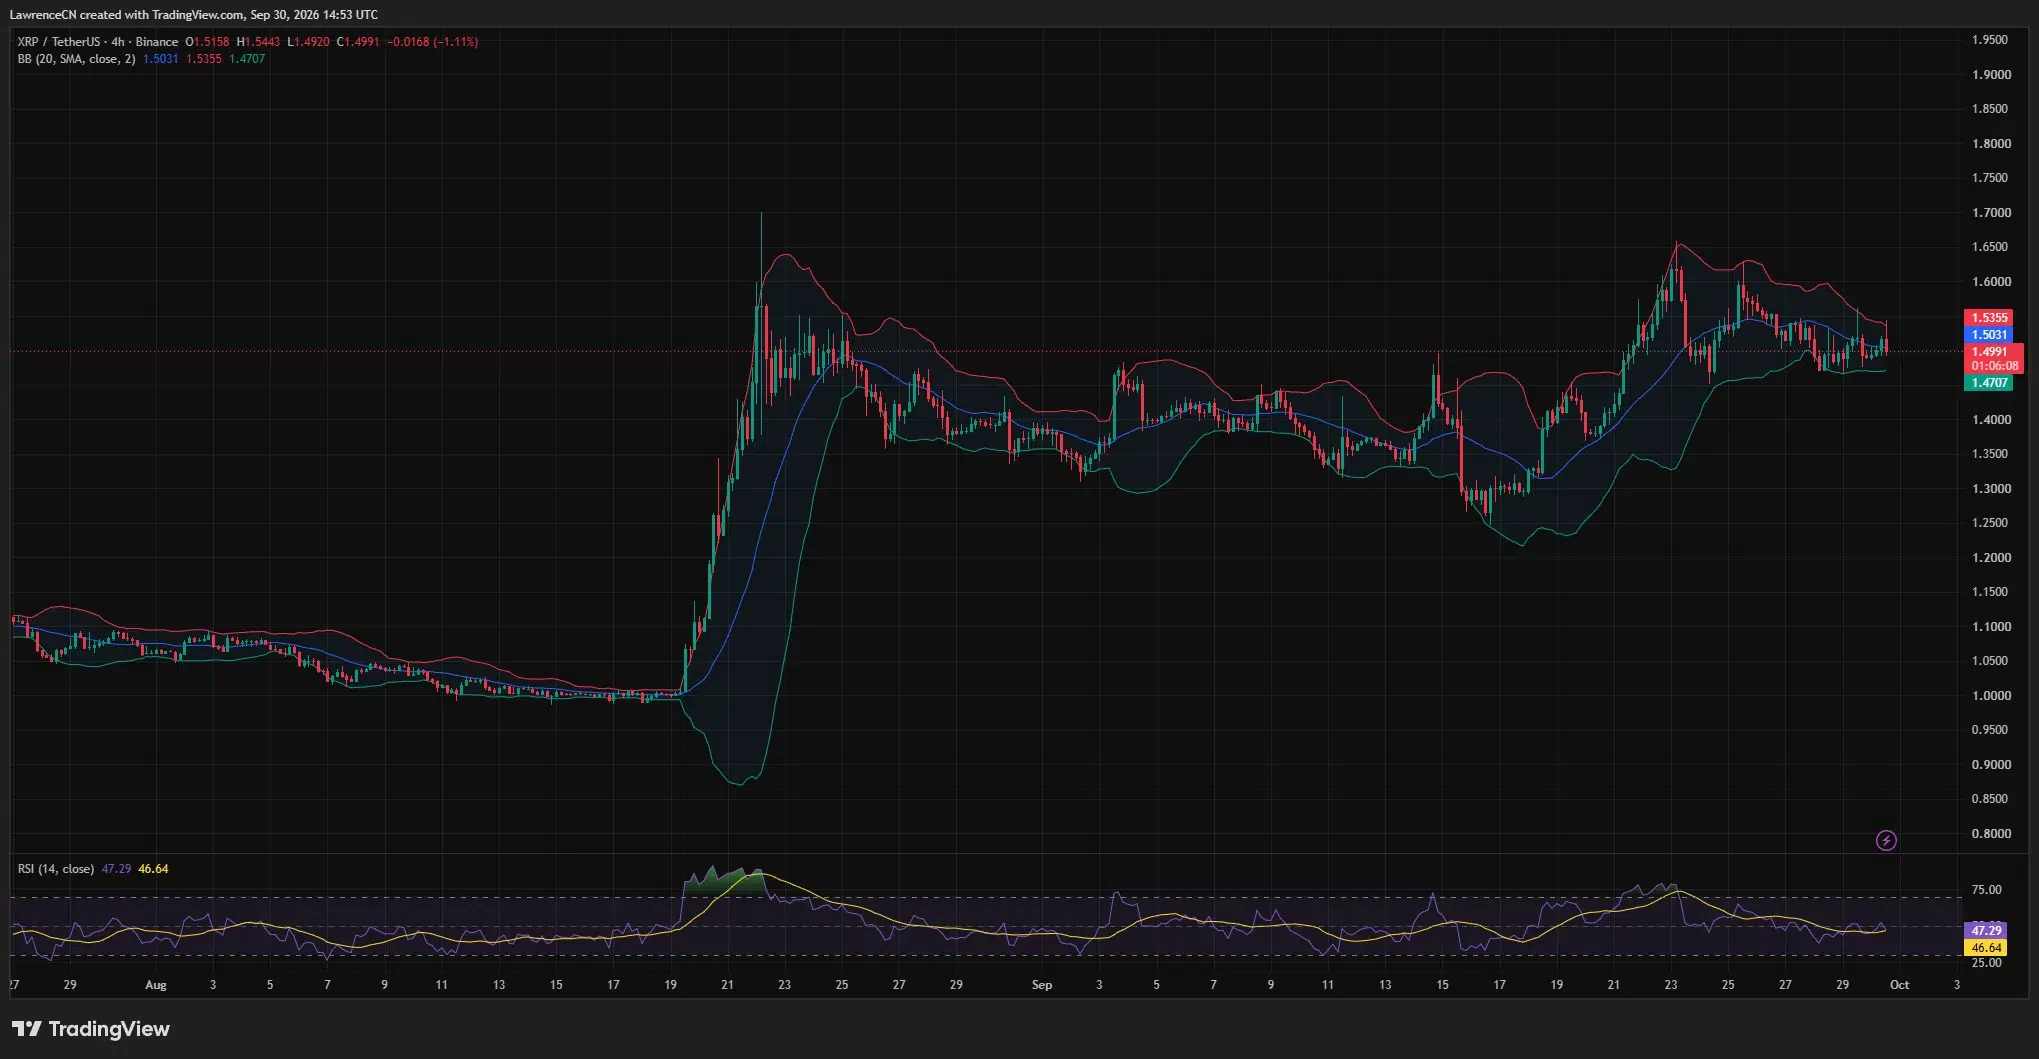
The bands have narrowed from their width during the September rally. Price has also moved closer to the middle of the range after repeatedly approaching the lower band during the recent pullback.
A sustained recovery above $1.5031 would put the upper band near $1.5355 back in focus. That level sits below the wider $1.55–$1.56 resistance area visible across the daily chart and liquidation heatmap.
The 4-hour Relative Strength Index reads 47.29, compared with its signal line at 46.64. Although RSI sits slightly above that line, it remains below the 50 midpoint, leaving the short-term momentum reading weaker than during XRP’s September advance.
Earlier in the rally, RSI moved above 75 as XRP approached its local highs. The latest reading places momentum closer to neutral, with the token still trading below its short-term moving average.
On the downside, the lower Bollinger Band at $1.4707 is the first nearby reference. A move beneath that level would bring XRP closer to daily support at $1.4648 and the recent lows around $1.45 visible on CoinGlass’s heatmap.
Daily resistance at $1.5625 caps the recovery
TradingView’s daily chart places XRP between two Murrey Math levels: $1.4648 below the market and $1.5625 above it. At approximately $1.4982, the token sits closer to the lower boundary.
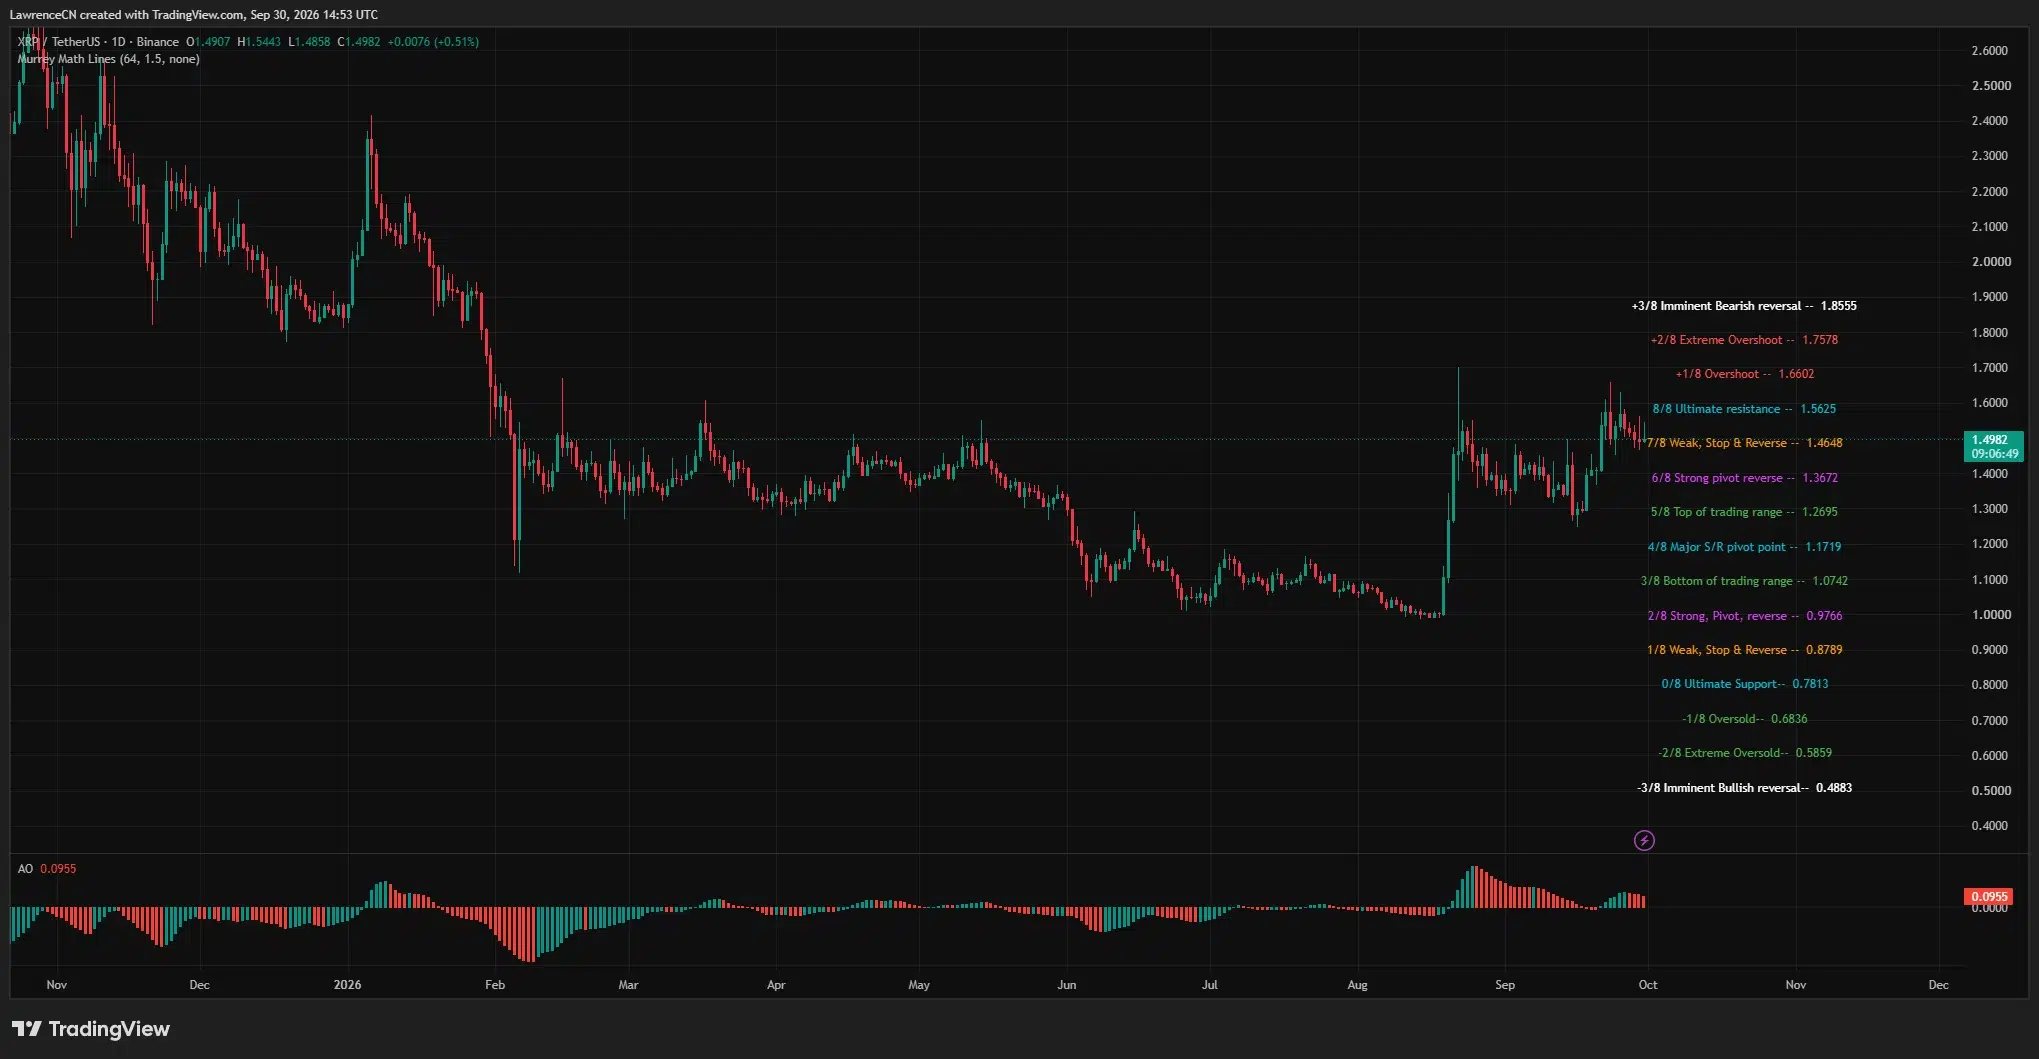
XRP’s latest daily trading range extends from $1.4858 to $1.5443. The move toward $1.54 has therefore left the token below the $1.5625 resistance line, despite recovering from the session’s low.
The daily chart also shows XRP retaining much of its recovery from the August trough near $1.00. However, the token has pulled back from September’s advance toward $1.65, leaving buyers defending a higher price base without yet recovering the recent peak.
Above $1.5625, the next plotted Murrey Math level is $1.6602, close to that September high. A sustained break through both levels would put $1.7578 into view on the same indicator.
Below $1.4648, the next daily level is $1.3672, followed by $1.2695. Those lower levels become relevant to the bearish chart scenario if XRP loses its current support area.
The daily Awesome Oscillator remains positive at 0.0955, but its latest bars are red. The indicator therefore shows positive momentum weakening as price consolidates below resistance.
XRP ETF inflows pause as futures exposure falls
SoSoValue data cited in the earlier market report shows U.S. spot XRP ETFs recorded no net inflows on Sep. 29. Net additions for the week beginning Sep. 28 stood at $3.96 million.
That followed approximately $75 million in inflows during the week ending Sep. 25, the strongest weekly total in four weeks, according to the same data.
For U.S. investors accessing XRP through these funds, the latest figures show a pause in net creations after the previous week’s larger additions. The weekly total remains positive, despite the absence of fresh inflows on Tuesday.
CoinGlass data also shows futures open interest falling from $3.73 billion on Sep. 28 to approximately $3.46 billion, a decline of about $270 million, or 7.2%.
XRP’s open-interest-weighted funding rate remains positive. Positive funding generally means long positions pay short positions; it does not establish that long accounts outnumber short accounts.
Spot-market commentary offers a more constructive view. In a Sep. 30 post, analyst CW said Binance had recorded net XRP buying the previous day while other exchanges showed net selling.
“However, today, net buying is being observed across all exchanges.”
CW’s observation points to a change in spot trading flows, even as aggregate futures exposure has declined.
Liquidation bands cluster above XRP’s current range
CoinGlass’s one-week heatmap shows prominent liquidation concentrations around $1.55–$1.57, with another bright band near $1.59. Additional clusters sit higher around $1.63–$1.64.
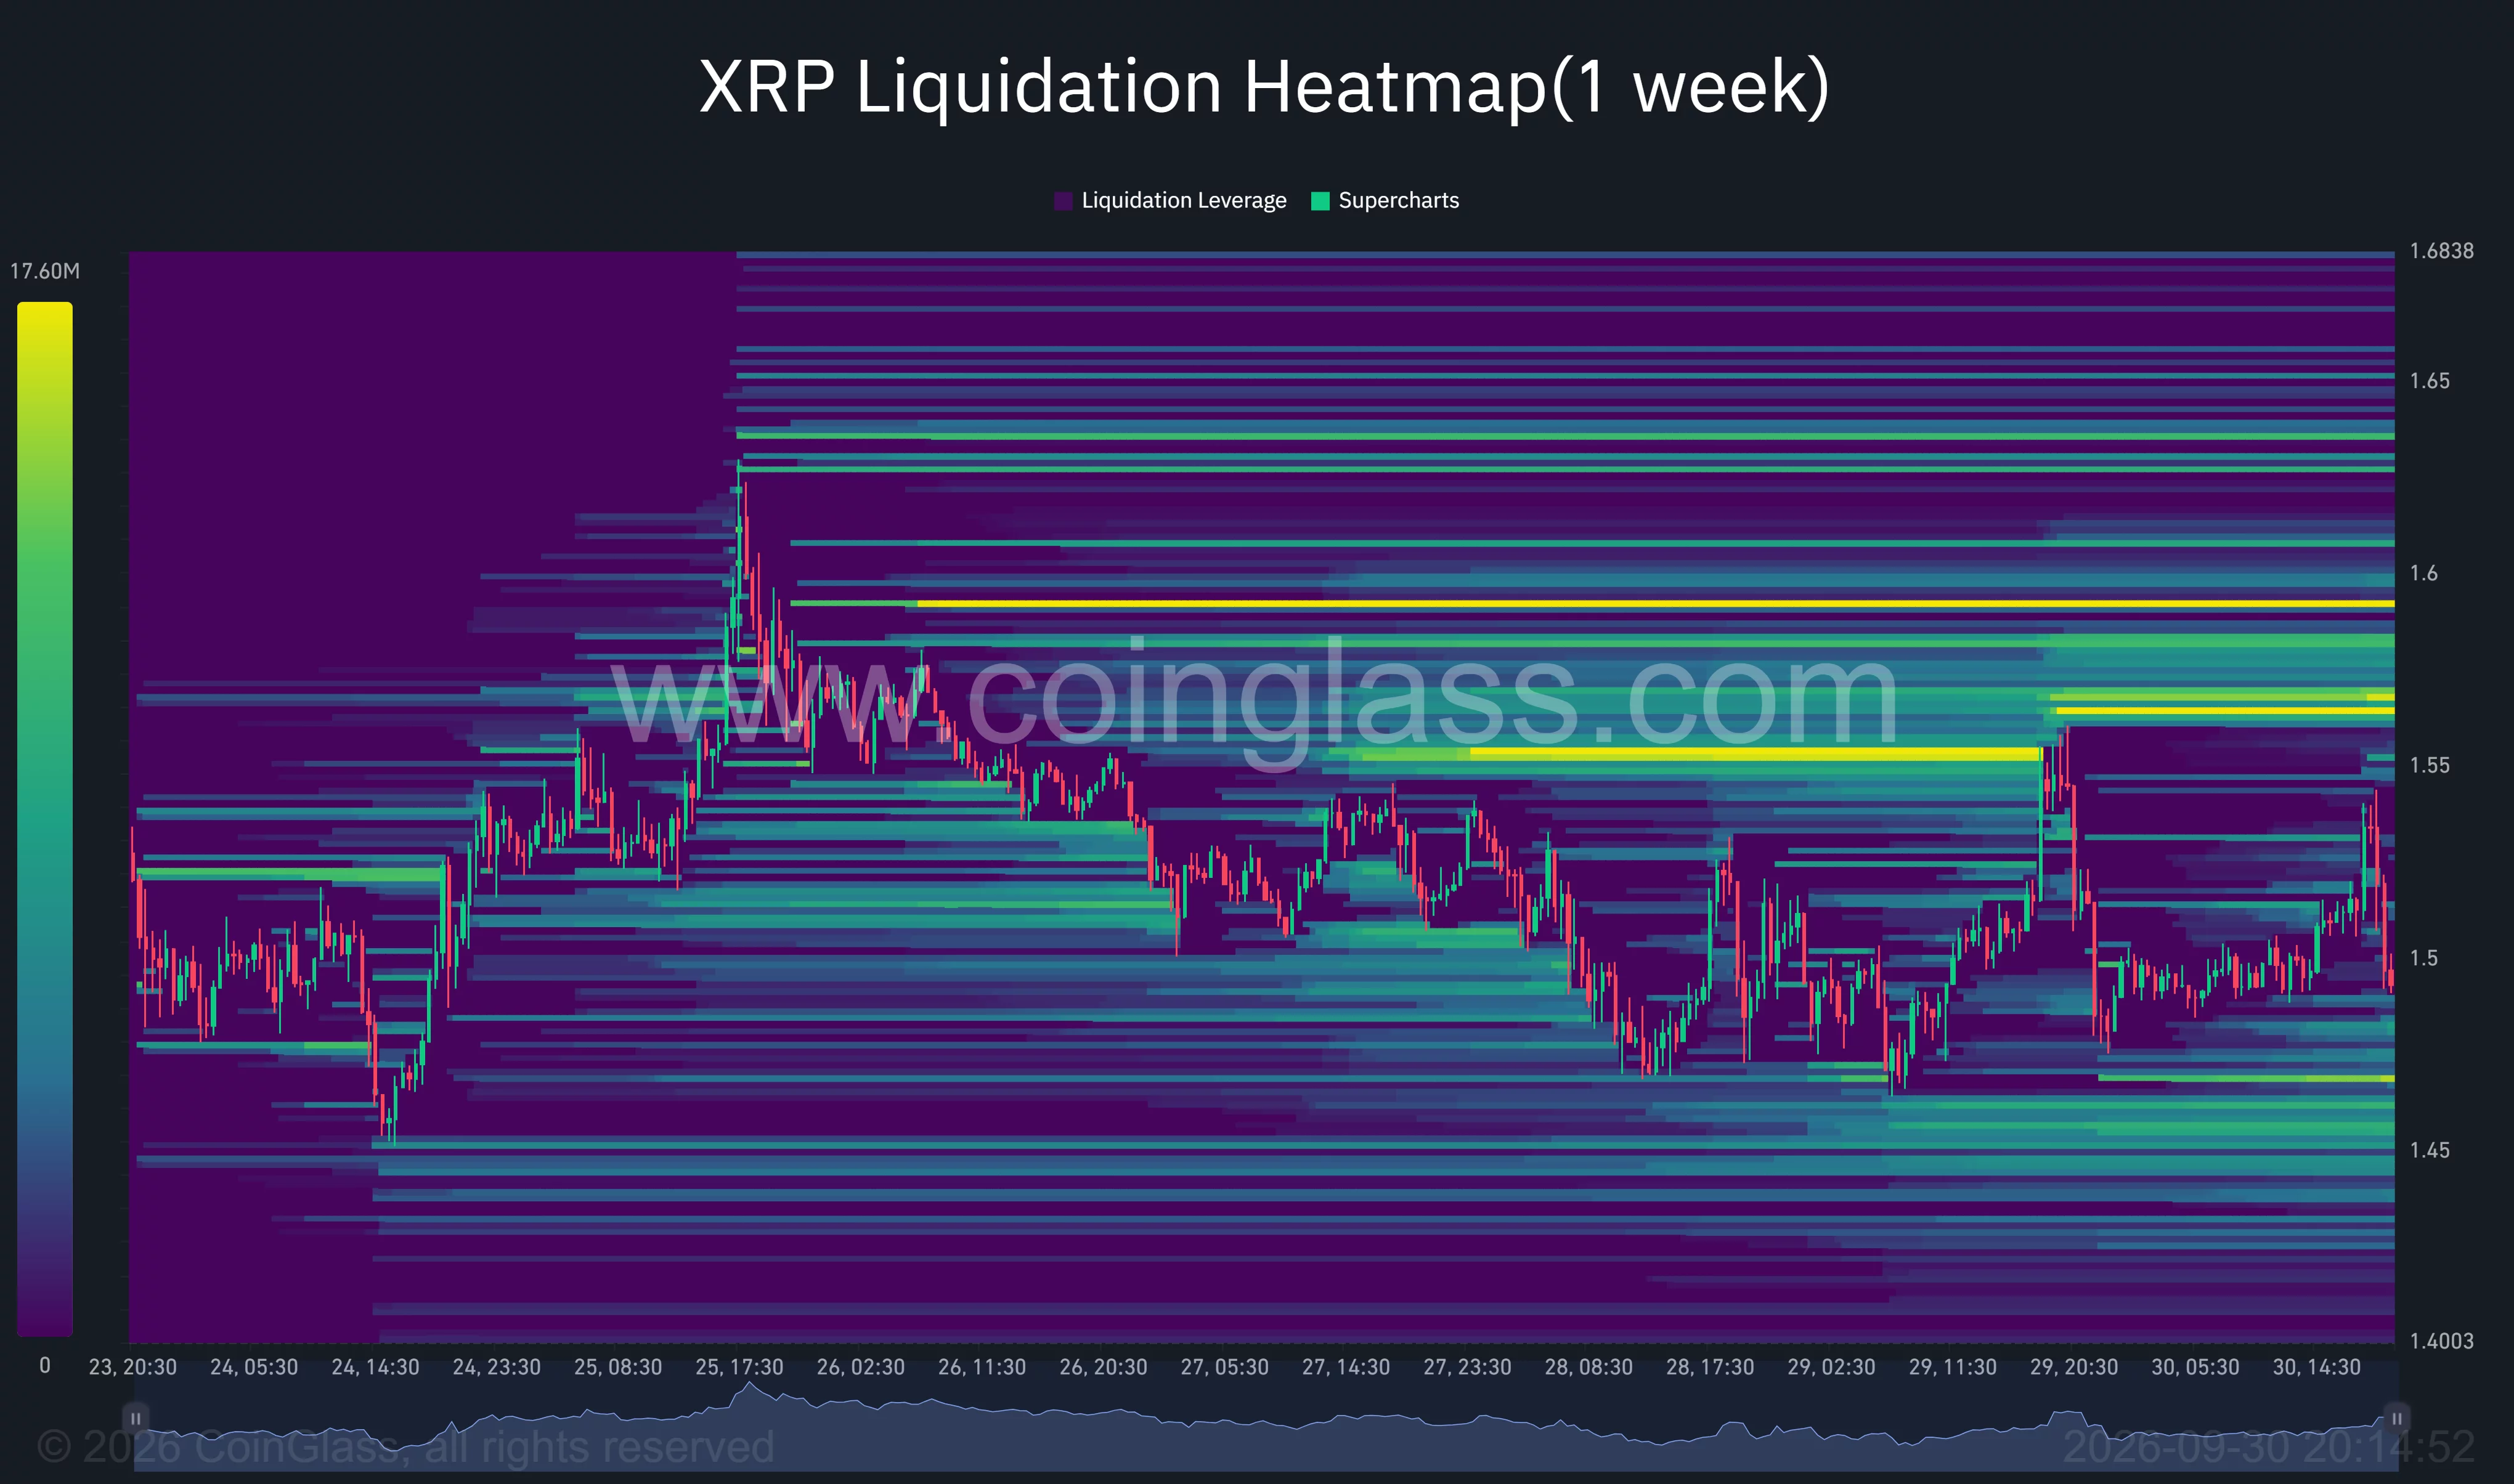
Below the market, visible concentrations appear around $1.47 and $1.45. XRP’s recent price path has repeatedly approached the lower area before rebounding toward $1.50.
The nearest overhead concentrations overlap with the daily resistance zone. A recovery through $1.5355 would bring XRP closer to both the $1.55–$1.57 liquidation bands and the daily resistance at $1.5625.
Analyst Wealthmanager offered a conditional bullish view in a separate Sep. 30 post, saying XRP had repeated a similar pattern at several levels since its breakout.
“If the structure holds, the next move can continue higher.”
The analyst’s chart marks successive support zones beneath XRP’s advances, with the latest around the current trading area. For that setup, holding the nearby support zone remains central, while a recovery above $1.5625 would strengthen the case for another test of September’s highs near $1.65.
Disclosure: This article does not represent investment advice. The content and materials featured on this page are for educational purposes only.