


Ethereum price has entered October near $2,695 after gaining 32.6% in August and another 8.8% in September, leaving $2,775–$2,800 as the main barrier standing between ETH and a possible move toward $3,000.
Summary
- Ethereum trades near $2,695, with $2,775–$2,800 remaining the main resistance zone entering October this month.
- U.S. spot Ether ETFs recorded $118 million in net outflows during the latest trading week.
- Glamsterdam is scheduled to activate on Sepolia October 6, while mainnet timing remains undecided still.
- Ethereum gained 32.6% in August and 8.8% in September before consolidating near $2,700 again now.
- A clean break above $2,800 could reopen $3,000, while $2,400–$2,500 remains key downside support area.
CoinGecko data showed ETH trading around $2,693–$2,695 on Oct. 4, up roughly 0.7% over 24 hours but nearly flat over seven days. The token traded between approximately $2,678 and $2,697 during the latest 24-hour period, with a market capitalization near $328 billion.
Ethereum has spent the opening days of October holding close to $2,700 after reaching an intraday high around $2,775 on Oct. 2. The price failed to hold the advance, falling back below $2,700 before stabilizing over the weekend.
Ethereum price needs to clear $2,800 for a $3,000 move
ETH has already completed much of the recovery setup that developed through August and September. Historical price data show Ethereum ended August near $2,467 after gaining roughly 32.6% during the month. September produced another gain of approximately 8.8%, with ETH finishing around $2,685.
Price action accelerated in the second half of September. ETH moved from roughly $2,398 on Sept. 15 to $2,775 by Sept. 21 before settling back into the $2,650–$2,700 region. The move pushed Ethereum above its earlier $2,400–$2,550 consolidation range but stopped short of establishing support above $2,800.
Technical analysis identified a similar structure after ETH broke above resistance near $2,661.52.Its chart placed interim resistance between roughly $2,775 and $2,825, with $3,050 as a possible continuation target if the breakout holds. A loss of approximately $2,560–$2,565 would weaken that setup.
For October, the immediate bullish case therefore rests on a relatively narrow price area. ETH would first need to close convincingly above roughly $2,775–$2,800. Holding that area as support would put $2,900 and $3,000 back into view, while the existing rising channel points toward approximately $2,950–$3,100 later in the month if momentum continues.
The monthly TradingView chart supplied for this analysis shows RSI at 51.53, above its moving average of 48.46. A reading above 50 indicates improving momentum, but it remains far from the 70 level normally associated with an overbought market.
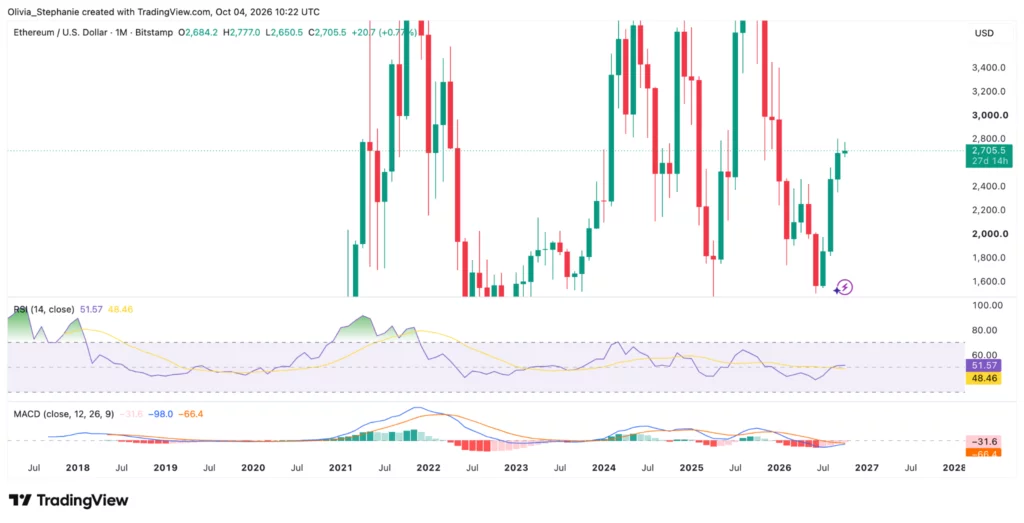
MACD remains weaker. The monthly MACD line sits near -98.3 compared with a signal line around -66.4, leaving the histogram near -31.9. The lines have moved closer together, but a bullish crossover has not occurred.
ETF buying has cooled after BlackRock’s September purchases
Institutional demand provided support during September, though the latest ETF figures show that buying has not remained one-directional.
Arkham Intelligence said on Sept. 17 that BlackRock’s Ethereum funds had acquired approximately $1.57 billion worth of ETH during the preceding 20 days. ETHA accounted for around $1.27 billion, while ETHB represented another $296.5 million. The figures described assets purchased by ETF products for investors, not ETH bought for BlackRock’s corporate balance sheet.
The more recent data are less bullish. Farside Investors recorded $59.6 million in combined U.S. spot Ether ETF outflows on Sept. 30, followed by $55.4 million on Oct. 1 and another $17.3 million on Oct. 2. Including earlier sessions, the Sept. 28–Oct. 2 week produced roughly $118 million in net outflows.
As crypto.news reported, Ethereum ETF outflows contrasted with the previous week, when the products attracted approximately $689.8 million.
The figures make the October ETF picture more mixed than the mid-September BlackRock buying data alone suggest. BlackRock’s earlier accumulation established strong demand during part of September, while the latest industry-wide numbers show capital leaving the U.S. Ether ETF complex as October began.
Exchange-flow data supplied by CryptoQuant analyst R3N show a similarly balanced picture on-chain. Ethereum exchange inflows and outflows tracked each other closely throughout most of September, with large two-way spikes occurring on several of the same dates.
The most recent reading showed approximately 129,700 ETH leaving exchanges compared with 116,700 ETH entering them. R3N described it as the first clear divergence after weeks of closely matched flows, while cautioning that one reading does not confirm a lasting accumulation trend.
Glamsterdam gives Ethereum an Oct. 6 network event
Ethereum’s next major network upgrade reaches an important test on Oct. 6.
The Ethereum Foundation has scheduled Glamsterdam to activate on the Sepolia testnet at 13:53:36 UTC on Oct. 6. Node operators on Sepolia must update both execution and consensus clients before the fork. Hoodi and Ethereum mainnet activation dates have not yet been finalized.
Glamsterdam combines the Amsterdam execution-layer upgrade with the Gloas consensus-layer changes. Its main features include enshrined proposer-builder separation and block-level access lists, along with changes to gas pricing designed to improve how Ethereum handles execution and state growth.
As crypto.news reported in its Glamsterdam coverage, the Sepolia activation is a public testing milestone and should not be described as an Ethereum mainnet launch.
The official Ethereum roadmap currently lists Glamsterdam for mainnet in Q4 2026 but says the date has not been confirmed. Results from Sepolia and later testing will therefore determine the next stages of deployment.
Another U.S. market development arrived on Oct. 2. The Securities and Exchange Commission approved a Cboe BZX rule change permitting the listing of a 3x Ether ETF alongside leveraged products linked to Bitcoin, gold, silver, crude oil and natural gas.
The product seeks three times the daily performance of an Ether futures benchmark. SEC approval of the exchange rule does not mean the leveraged product provides a forecast for ETH or guarantees additional spot demand.
Ethereum price prediction for October points to three scenarios
The main October setup remains centered on $2,800 resistance and support around the lower boundary of Ethereum’s rising channel.
| October setup | Price area | What would need to happen |
| Channel holds | $2,650–$3,050 | ETH defends its rising structure and clears $2,775–$2,800 |
| Consolidation | $2,500–$2,800 | Buyers defend the recovery, but repeated attempts above $2,800 fail |
| Channel breaks | $2,400–$2,500 | ETH loses channel support and retests its former breakout zone |
The first scenario keeps $3,000 reachable without requiring ETH to enter a completely new price structure. A confirmed move above $2,800 would place Ethereum beyond the rejection area seen in late September and early October.
Crypto.news’ Ethereum price model currently gives October a base scenario around $3,034, with a bearish estimate near $2,579 and a bullish estimate around $3,641. Model-generated forecasts are not guaranteed price targets and can change as new market data arrive.
A weaker October would begin to take shape if Ethereum loses the mid-$2,600 region and fails to reclaim it. The next major area from the supplied chart lies around $2,400–$2,500, where resistance repeatedly formed earlier in 2026 before ETH broke higher.
Below that region, the next technical warning area sits near $2,350–$2,360. Its analysis said a break below that range could invalidate the recent bullish continuation pattern.
Analyst Ted Pillows is watching the opposite boundary. He said ETH needs to reclaim $2,800 on the weekly close to strengthen bullish momentum, making the level the immediate test before traders begin treating $3,000 as a more established target.
Ali Martinez is looking much further out. According to the analyst, Ethereum has traded within a rising monthly channel extending more than five years, with its upper boundary near $5,000. He said a break above that level could produce a projected move toward $8,800. The setup is a conditional long-term chart projection, not an October forecast.
Citi’s latest institutional forecast is more restrained. The bank raised its 12-month Ether target to $3,028 from $2,240 on Oct. 1, citing increased crypto activity, macroeconomic conditions and renewed ETF demand. The forecast covers a 12-month horizon and should not be interpreted as an October target.
Ethereum price prediction FAQs
Can Ethereum price reach $3,000 in October?
Ethereum can reach $3,000 within its existing technical structure if ETH breaks and holds above roughly $2,775–$2,800. Technical analysis places a continuation target near $3,050 after the recent breakout, while failure at $2,800 would keep ETH inside its current consolidation range.
What is the most important Ethereum resistance?
The immediate resistance sits around $2,775–$2,800. ETH reached roughly $2,775 on Oct. 2 but failed to sustain the move, leaving that area as the main short-term ceiling.
What Ethereum price level would weaken the bullish case?
A move below roughly $2,560 would weaken the short-term recovery, while the $2,400–$2,500 region remains the larger support area from the current ascending-channel structure. Another technical warning zone sits around $2,350–$2,360.
When is Ethereum’s Glamsterdam upgrade?
Glamsterdam is scheduled to activate on the Sepolia testnet on Oct. 6 at 13:53:36 UTC. Ethereum developers have not yet announced final Hoodi or mainnet activation dates.
Are Ethereum ETFs still seeing strong inflows?
Not during the latest week. U.S. spot Ether ETFs recorded approximately $118 million in net outflows from Sept. 28 through Oct. 2 after attracting $689.8 million in the preceding week.
Disclosure: This article does not represent investment advice. The content and materials featured on this page are for educational purposes only.