


Bitcoin price has deteriorated over recent weeks, with repeated bearish daily closes below key support increasing downside risk toward $54,860.
Summary
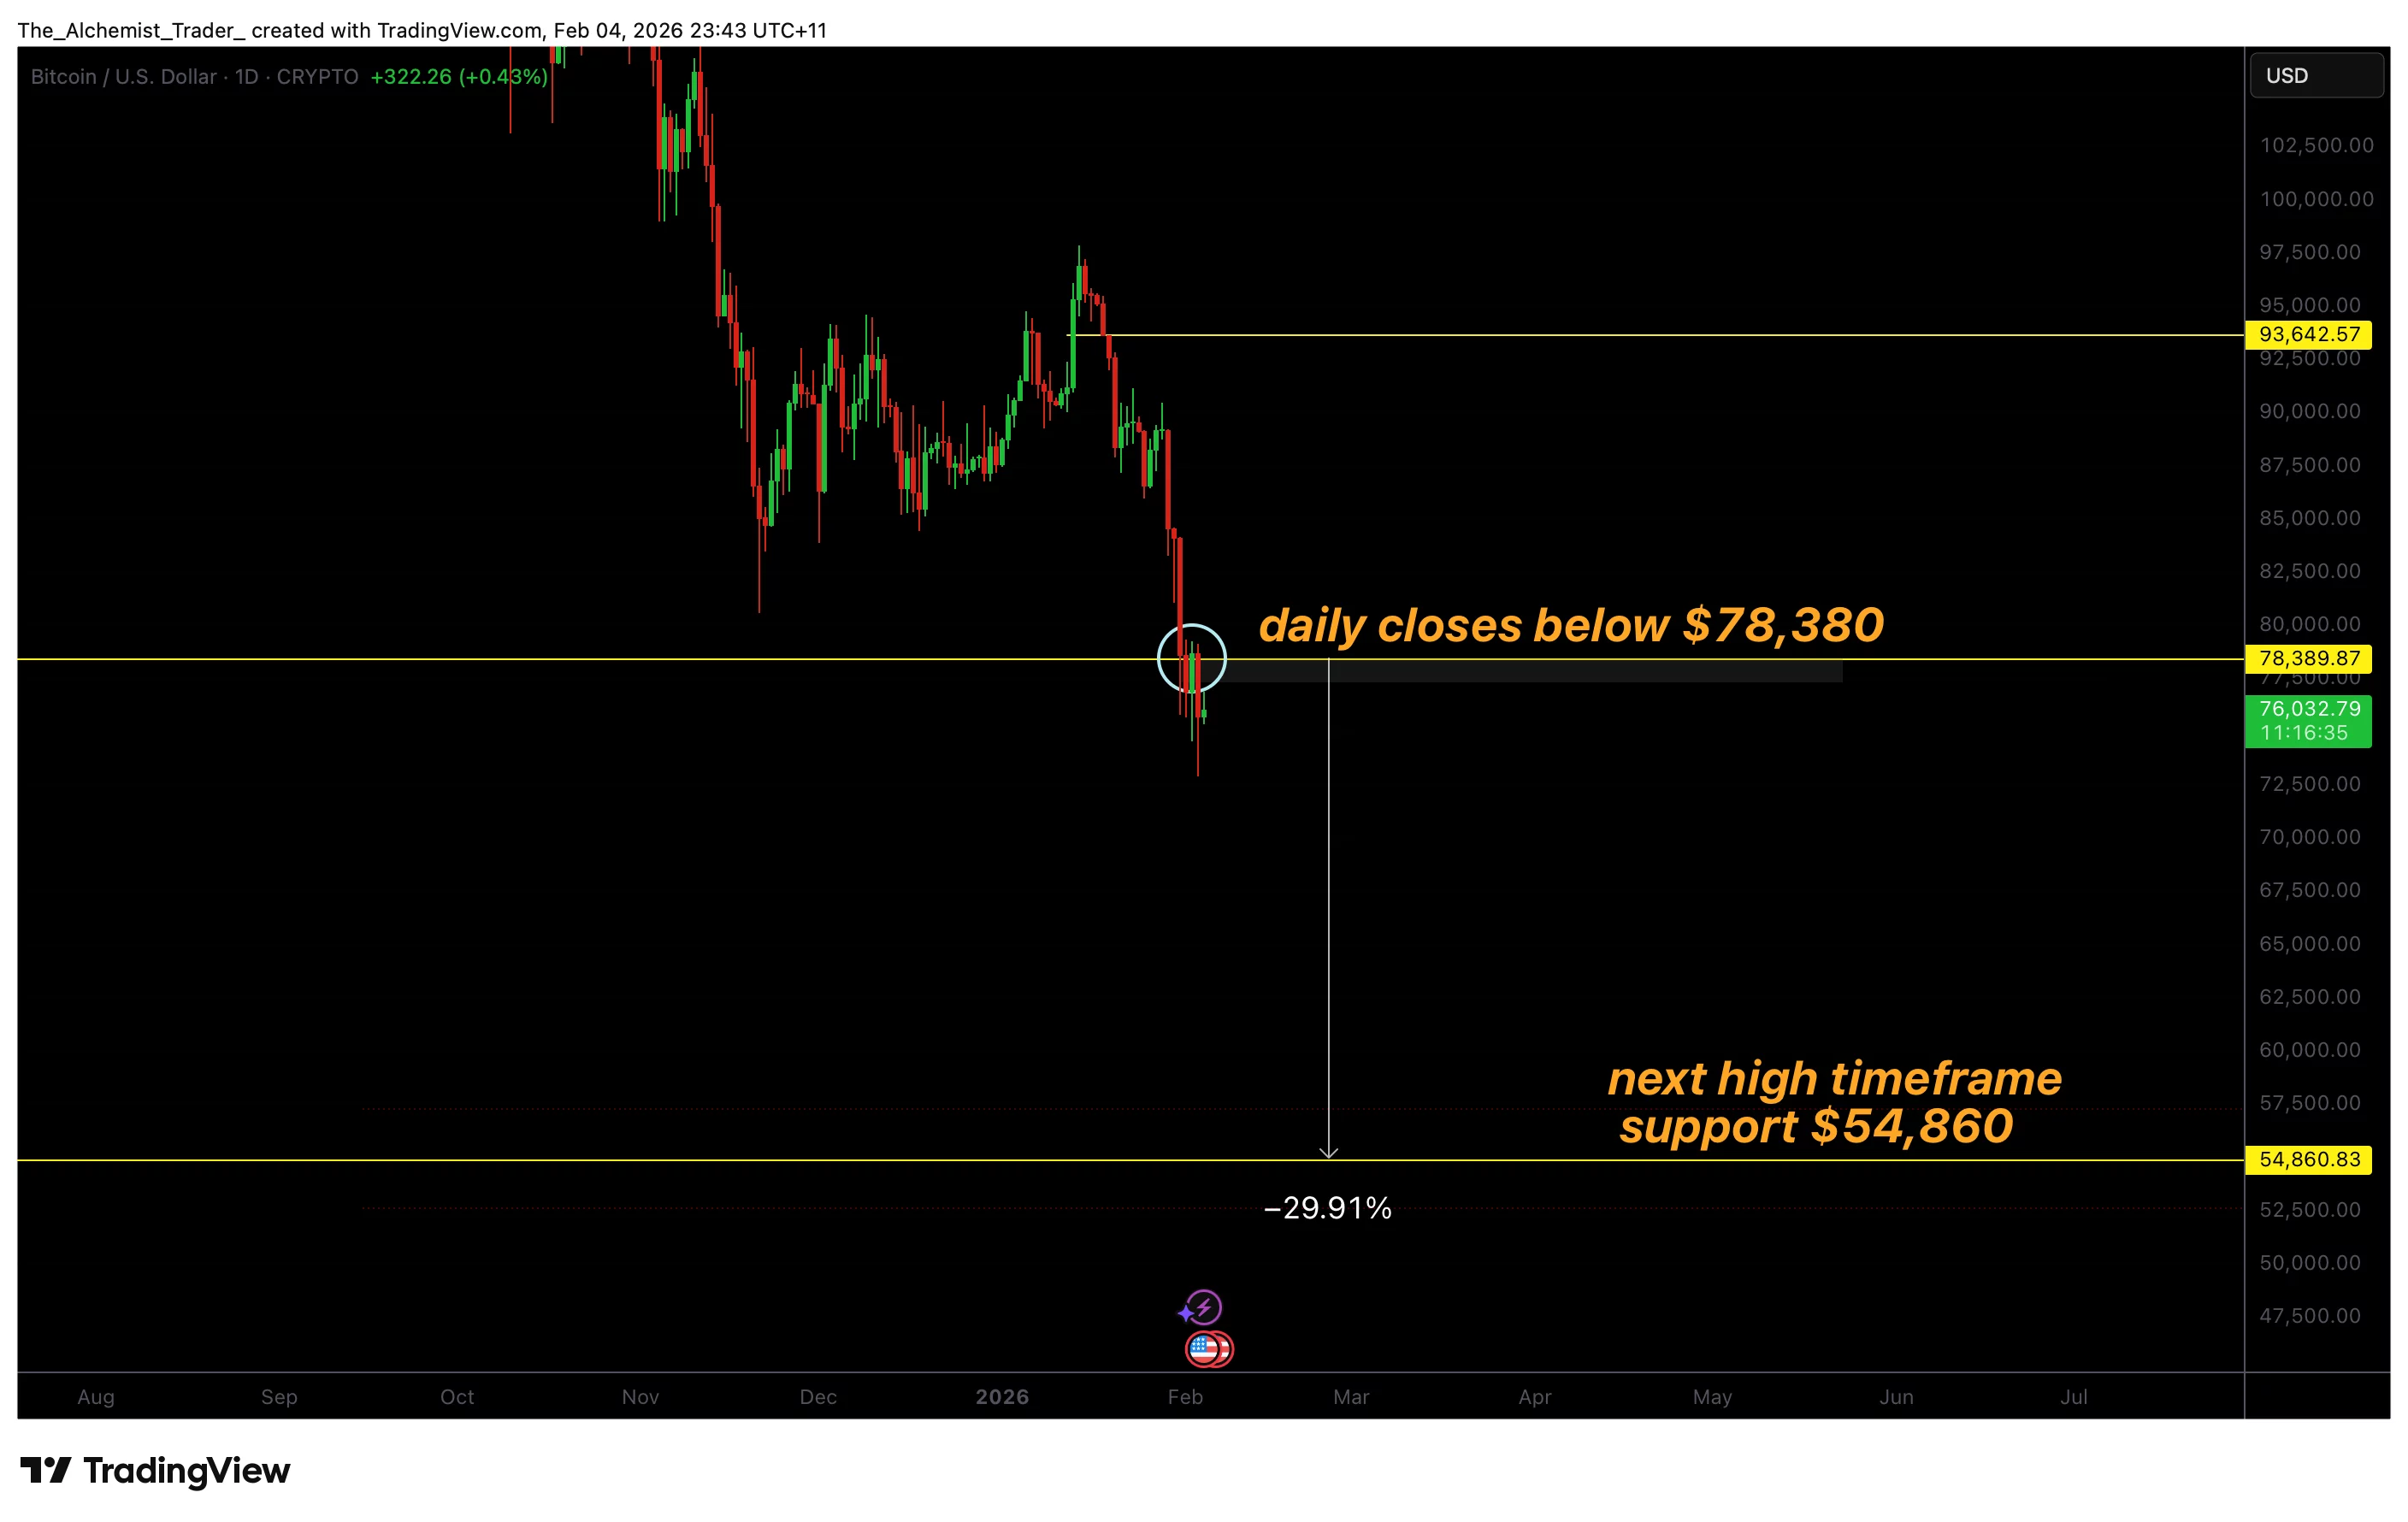
- Bitcoin is trading below the $78,000–$78,289 support on daily closes
- Downside risk increases toward $54,860, high-timeframe support
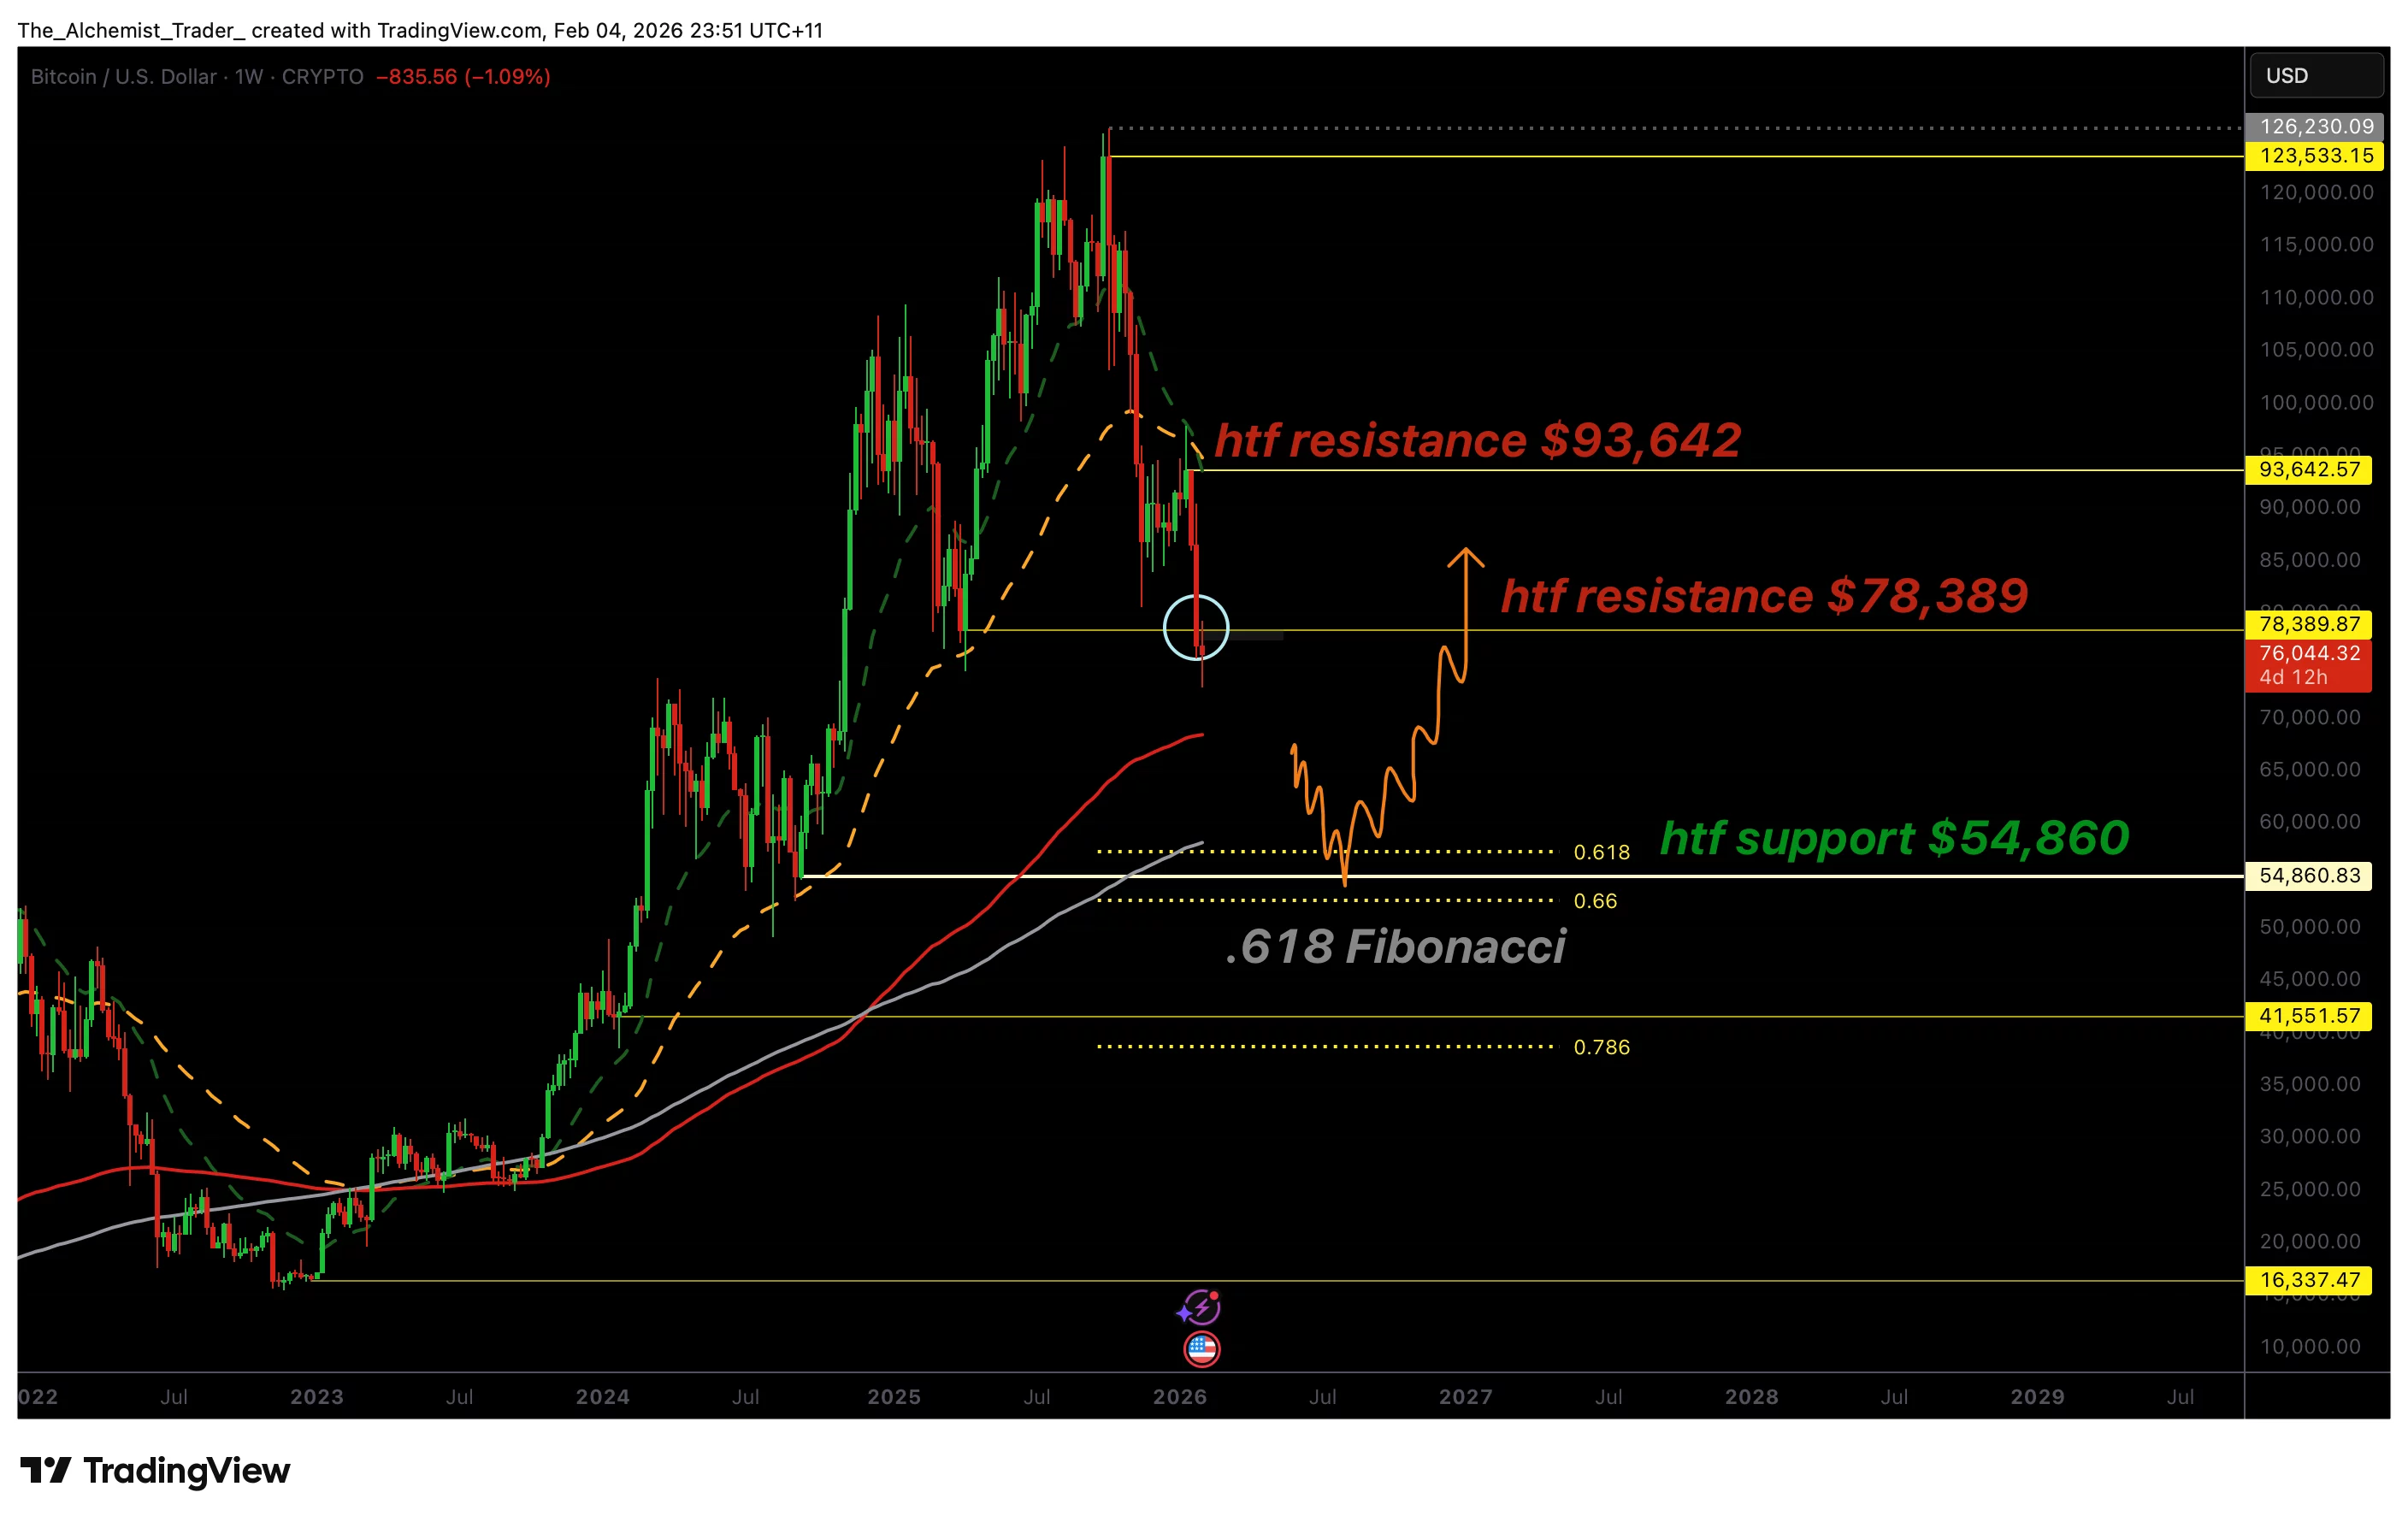
- 0.618 Fibonacci confluence may allow a potential market low to form
Bitcoin (BTC) price has entered a vulnerable phase after failing to hold several critical technical levels that previously supported price action. Over the past few weeks, the market has shifted from consolidation into sustained weakness, with sellers gaining control across multiple timeframes. This transition has been reinforced by consecutive bearish daily candle closes, signaling acceptance below former support rather than a brief liquidity sweep.
The most important development has been Bitcoin’s failure to reclaim the $78,000–$78,289 region. This zone previously acted as a high-timeframe pivot, separating bullish continuation from corrective downside.
With price now trading below this area on a daily closing basis, the technical bias has turned decisively bearish. As long as this condition persists, the probability increases for a deeper corrective move, or even capitulation toward the next major high-timeframe support near $54,860.
Bitcoin price key technical points
- Daily closes below $78,000–$78,289: Acceptance below former support strengthens bearish continuation risk
- $54,860 emerges as next major downside target: High-timeframe support and Fibonacci confluence align here
- 0.618 Fibonacci retracement in focus: This level often acts as a magnet for price and a potential reversal zone
From a price action and market structure perspective, Bitcoin’s recent behavior reflects a clear loss of bullish control. The $78,000–$78,289 region had previously functioned as a reliable support zone, absorbing sell pressure and allowing price to stabilize. Once this level was lost, the market failed to produce a meaningful reclaim, indicating that demand at higher prices has weakened materially.
Daily candle closes below former support are particularly significant. Unlike intraday wicks or brief breakdowns, daily acceptance below a level suggests that sellers are comfortable transacting at lower prices. This behavior often precedes extended downside moves, especially when it occurs after a prolonged period of distribution or topping price action.
As Bitcoin continues to trade below this zone, downside momentum remains favored. Each failed attempt to reclaim lost support reinforces the bearish structure and increases the likelihood of a cascading move lower as stop liquidity is triggered beneath successive levels.
Why $54,860 is a high-probability target
The $54,860 region stands out as the next major area of interest for several reasons. First, it represents a high-timeframe structural support, where buyers have historically stepped in to defend price. Levels of this magnitude often attract significant attention from longer-term participants, increasing the probability of a reaction.
Second, this region aligns closely with the 0.618 Fibonacci retracement of the broader high-timeframe move. The 0.618 level is widely regarded as a key retracement zone in trending markets and frequently acts as a magnet during corrective phases. When price accelerates lower, it often seeks out this level before any meaningful attempt at stabilization occurs.
The confluence between Fibonacci support and structural demand creates a “pocket” in price action. Markets tend to move efficiently between such pockets, particularly when intermediate support levels fail to hold. This dynamic increases the probability that Bitcoin will test the $54,860 region if bearish pressure persists.
Capitulation versus controlled correction
A move toward $54,860 does not necessarily imply structural failure or the end of Bitcoin’s broader market cycle. From a market-structure perspective, such a decline could represent a deep corrective move within a larger framework rather than a trend-ending event.
Capitulation-style moves are often characterized by accelerated downside momentum, emotional selling, and sharp volatility expansion. While uncomfortable, these conditions can also set the stage for meaningful reversals, particularly when they occur at high-confluence technical levels. If Bitcoin reaches $54,860 under capitulative conditions, the probability of a reaction increases, provided selling pressure begins to exhaust.
However, it is important to distinguish between a temporary bounce and a confirmed reversal. A sustainable shift in trend would require evidence of accumulation, such as slowing downside momentum, higher lows on lower timeframes, and expanding bullish volume following the test of support.
Market Structure Implications at $54,860
From a broader technical perspective, a move into the $54,860 zone would reset market conditions. It would allow Bitcoin to retest a critical Fibonacci retracement while also re-engaging long-term demand. This combination creates a scenario where a macro low could potentially form, especially if buyers step in aggressively.
That said, the market must prove this thesis through price behavior rather than assumption. Without confirmation, any bounce from $54,860 risks being corrective rather than trend-changing. Until then, the path of least resistance remains lower as long as Bitcoin trades below reclaimed resistance.
What to expect in the coming price action
As long as Bitcoin continues to post daily closes below the $78,000–$78,289 region, downside risk remains elevated. The technical structure favors continuation toward the $54,860 high-timeframe support, where both structural demand and the 0.618 Fibonacci retracement converge.
If the price reaches this level, market participants should watch closely for signs of capitulation followed by stabilization. Strong reactions, bullish volume influxes, and improving structure would increase the probability of a reversal forming. Until such evidence appears, Bitcoin remains in a bearish corrective phase, with $54,000 firmly in focus as the next major test for the market.


")