
U.S. spot Bitcoin exchange-traded funds shed around $681 million over the past week as institutional demand appears to be losing momentum. Despite this, charts show a highly bullish pattern remains at play.
Summary
- Bitcoin price has rebounded back after a bearish week.
- Bitcoin ETFs logged $681 million in net outflows over the past week.
- An Adam and Eve pattern was observed on the daily chart.
According to data from SoSoValue, the 12 spot Bitcoin ETFs recorded $681 million in net outflows over the past week, dated Jan. 5-Jan. 9.
Fidelity’s FBTC was hit the hardest, losing $481 million from the fund, while Grayscale’s GBTC and ARK Invest’s ARKB followed with $171.8 million and $45.4 million in outflows, respectively. Grayscale’s mini Bitcoin Trust and HODL and BITB ETFs also saw a combined outflow of $46.1 million.
Offsetting a small part of these outflows, BlackRock’s IBIT had drawn in $25.9 million over the week while the remaining ETFs contributed another $37.7 million.
These outflows followed a strong week in which investment products drew in $458.7 million, a surge that helped push Bitcoin back above $94,000 for the first time since losing this level in early December.
However, the momentum was short-lived as widespread profit-taking and intense volatility triggered by massive liquidations in the Bitcoin market placed renewed downward pressure on the flagship digital asset. It is likely that the downturn has dampened institutional demand as investors wait for the volatility to cool off.
Bitcoin (BTC) price has recovered from some of its weekly losses, changing hands at $91,652 as of Jan. 12, afternoon Asian time. Despite this recovery, the asset still remains nearly 27.3% below its all-time high of $126,080 reached on Oct. 6, 2025.
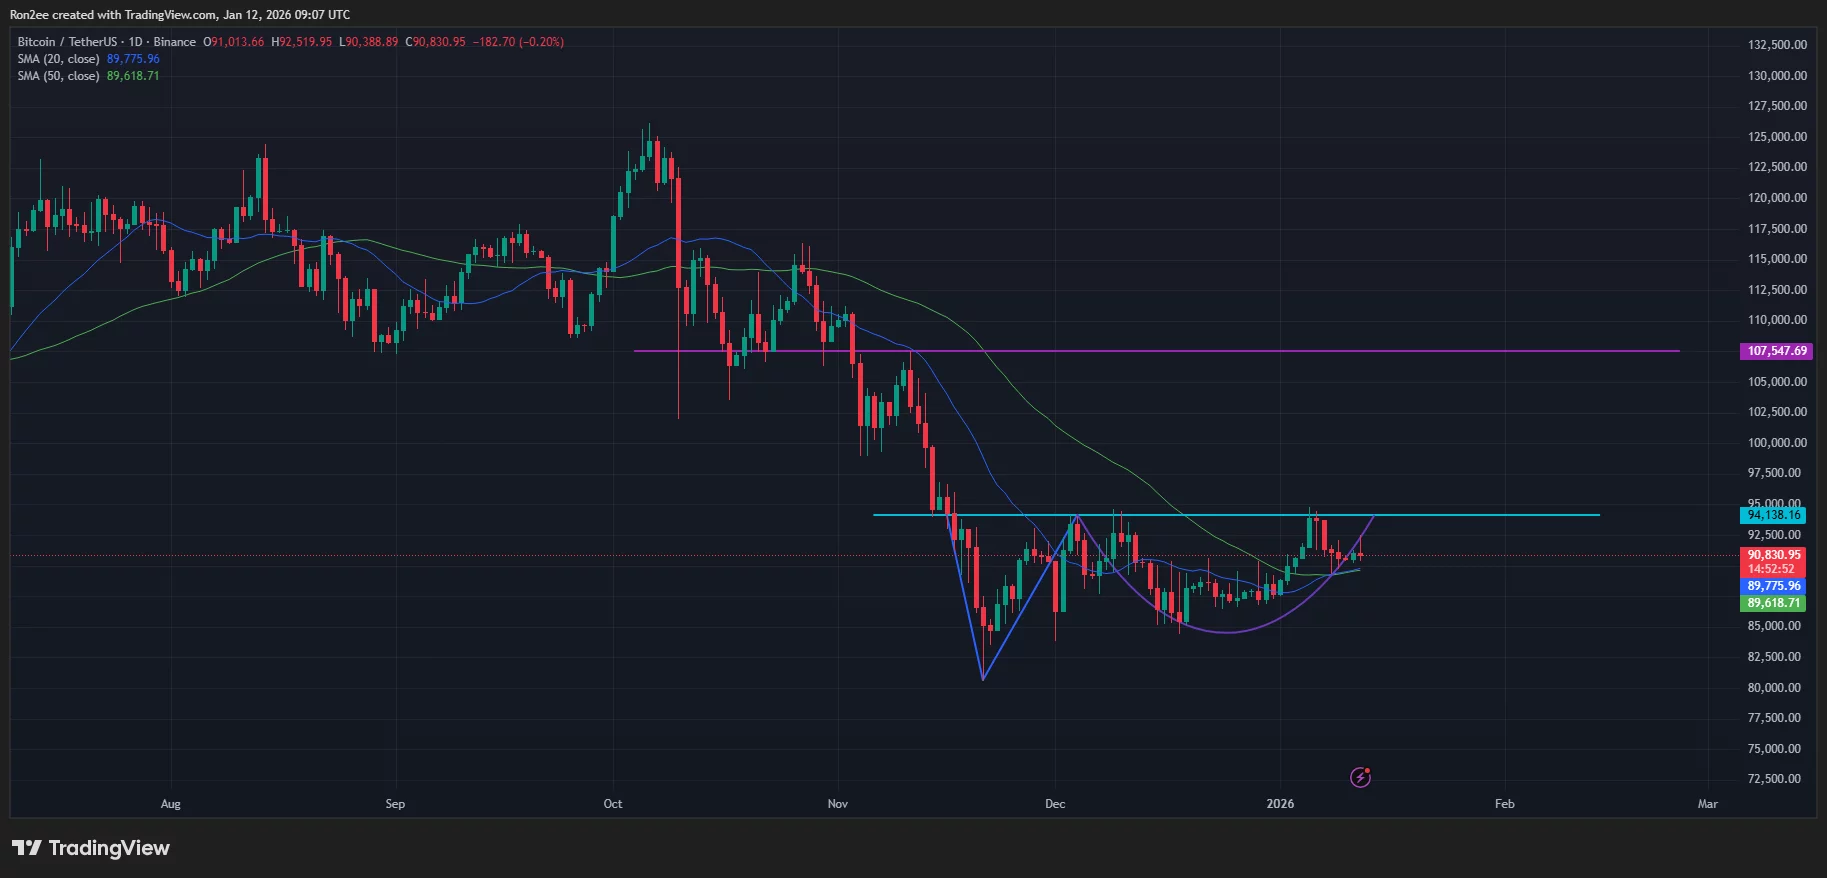
Looking at the daily chart, Bitcoin price appears to have formed an Adam and Eve pattern since mid-November last year. The pattern, characterized by a sharp V-shaped spike followed by an extended rounded bottom, typically serves as a precursor to a bullish reversal once the price breaks above the neckline resistance.
A confirmed breakout from the pattern neckline at $94,138 could instill buyers to target the Nov. 11 high of $107,500 next, with relatively few major hurdles in between.
Bitcoin may attempt a breakout soon as technical indicators lean in favor of the bulls. Notably, the 20-day SMA has formed a bullish crossover with the 50-day SMA, a move that often suggests a resumption of upward momentum on shorter timeframes.
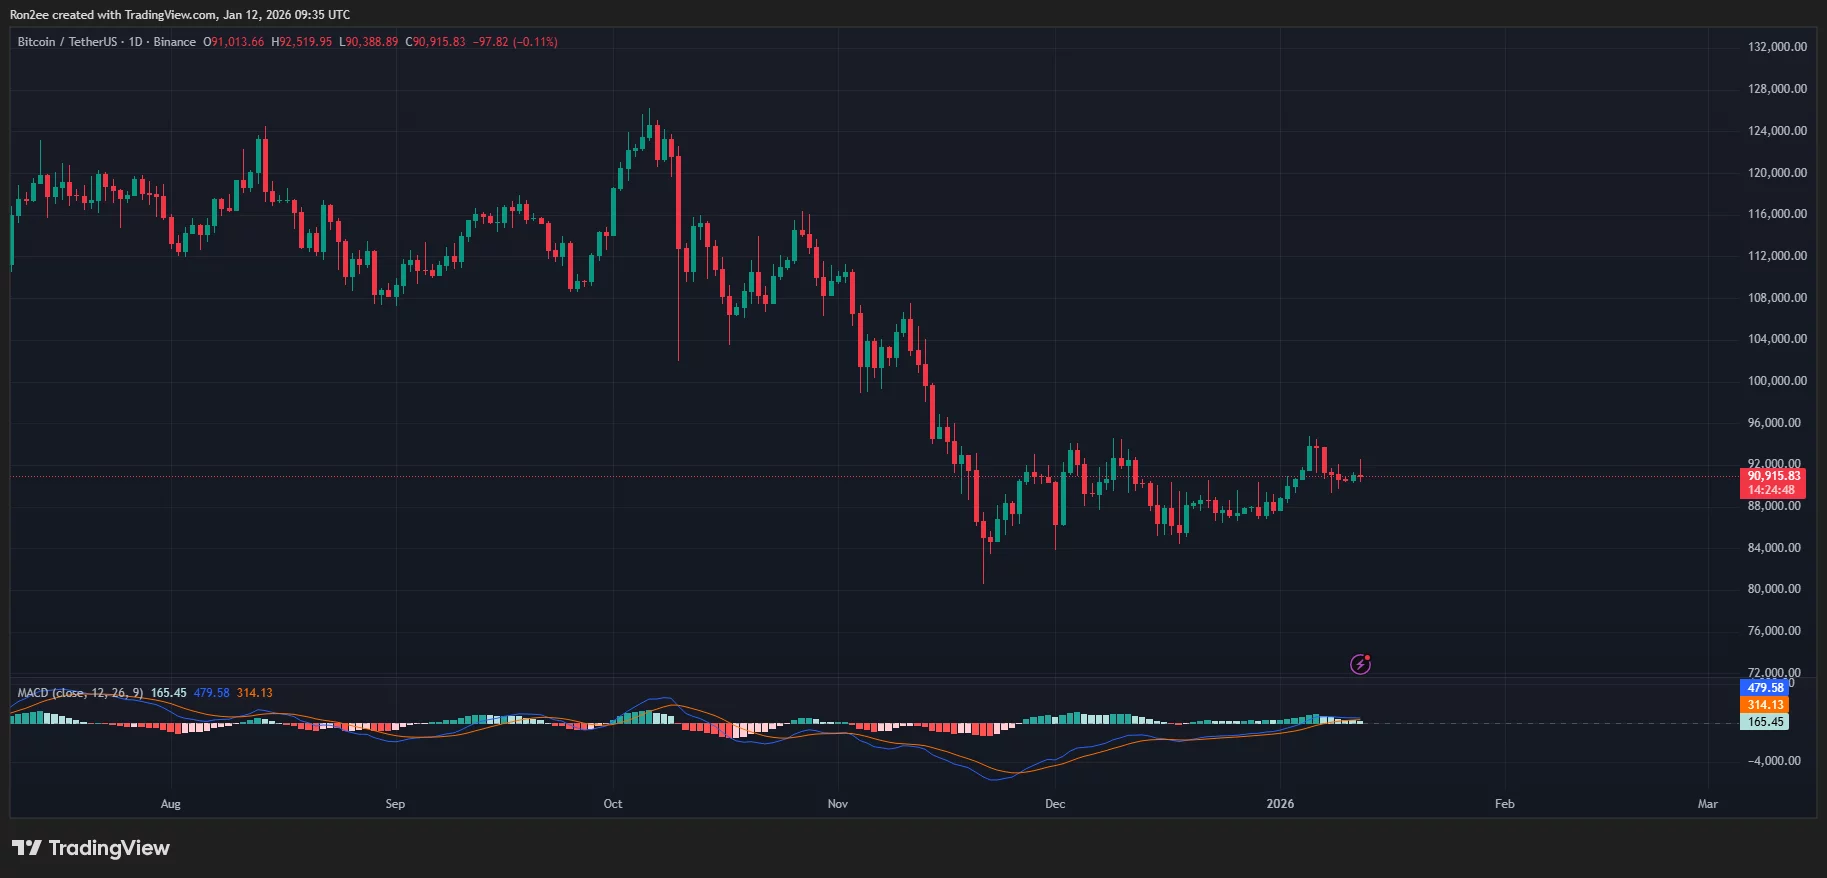
Momentum indicators like the MACD lines were also flashing buy signals when writing, indicating that selling pressure may be easing.
On the contrary, $89,600, which aligns closely with the 50-day SMA, is expected to serve as a critical level of support that bulls need to defend to avoid further downside.
Disclosure: This article does not represent investment advice. The content and materials featured on this page are for educational purposes only.