


Polygon price continued its bull run, continuing a trend that started on January 1, as its transactions and burn rate soared.
Summary
- Polygon price continued soaring as the bull run accelerated.
- The POL burn rate has continued to soar in the past few months.
- Other network metrics like DEX volume and stablecoin transactions have soared.
Polygon (POL) has now jumped in each day of this year and is hovering at its highest level since Nov. 11. It has soared by over 80% from its lowest level this year.
The rally is a massive reversal after the token plunged by 66% from its highest level in September to its lowest point in December. This crash happened as the network continued to lose market share to other layer-2 networks like Base, Optimism, and Arbitrum.
Polygon’s surge is happening as its token burn accelerates. Data shows that the network has burned millions of tokens this year alone, much higher than what it incinerated in 2025.
The network’s fees have also soared this month. Data compiled by DeFi Llama shows that the network has made $1.7 million in fees this year alone. Its fees rose to $691,091 in December, $928,335 in November, and $538,231 in October.
Other metrics show that the network is doing well, with the decentralized exchange volume soaring to over $246 million on Sunday, higher than the previous day’s $245 million. Its volume rose to over $2.28 billion this month, meaning that it will cross the $5.89 billion it handled last month.
Polygon has also continued to do well in other areas, especially in the payment industry, where it has been embraced by other companies like Stripe, Revolut, and Shift4 Payments. It has also become a major player in the predictions market, where it is the blockchain network for Polymarket.
Polygon price technical analysis
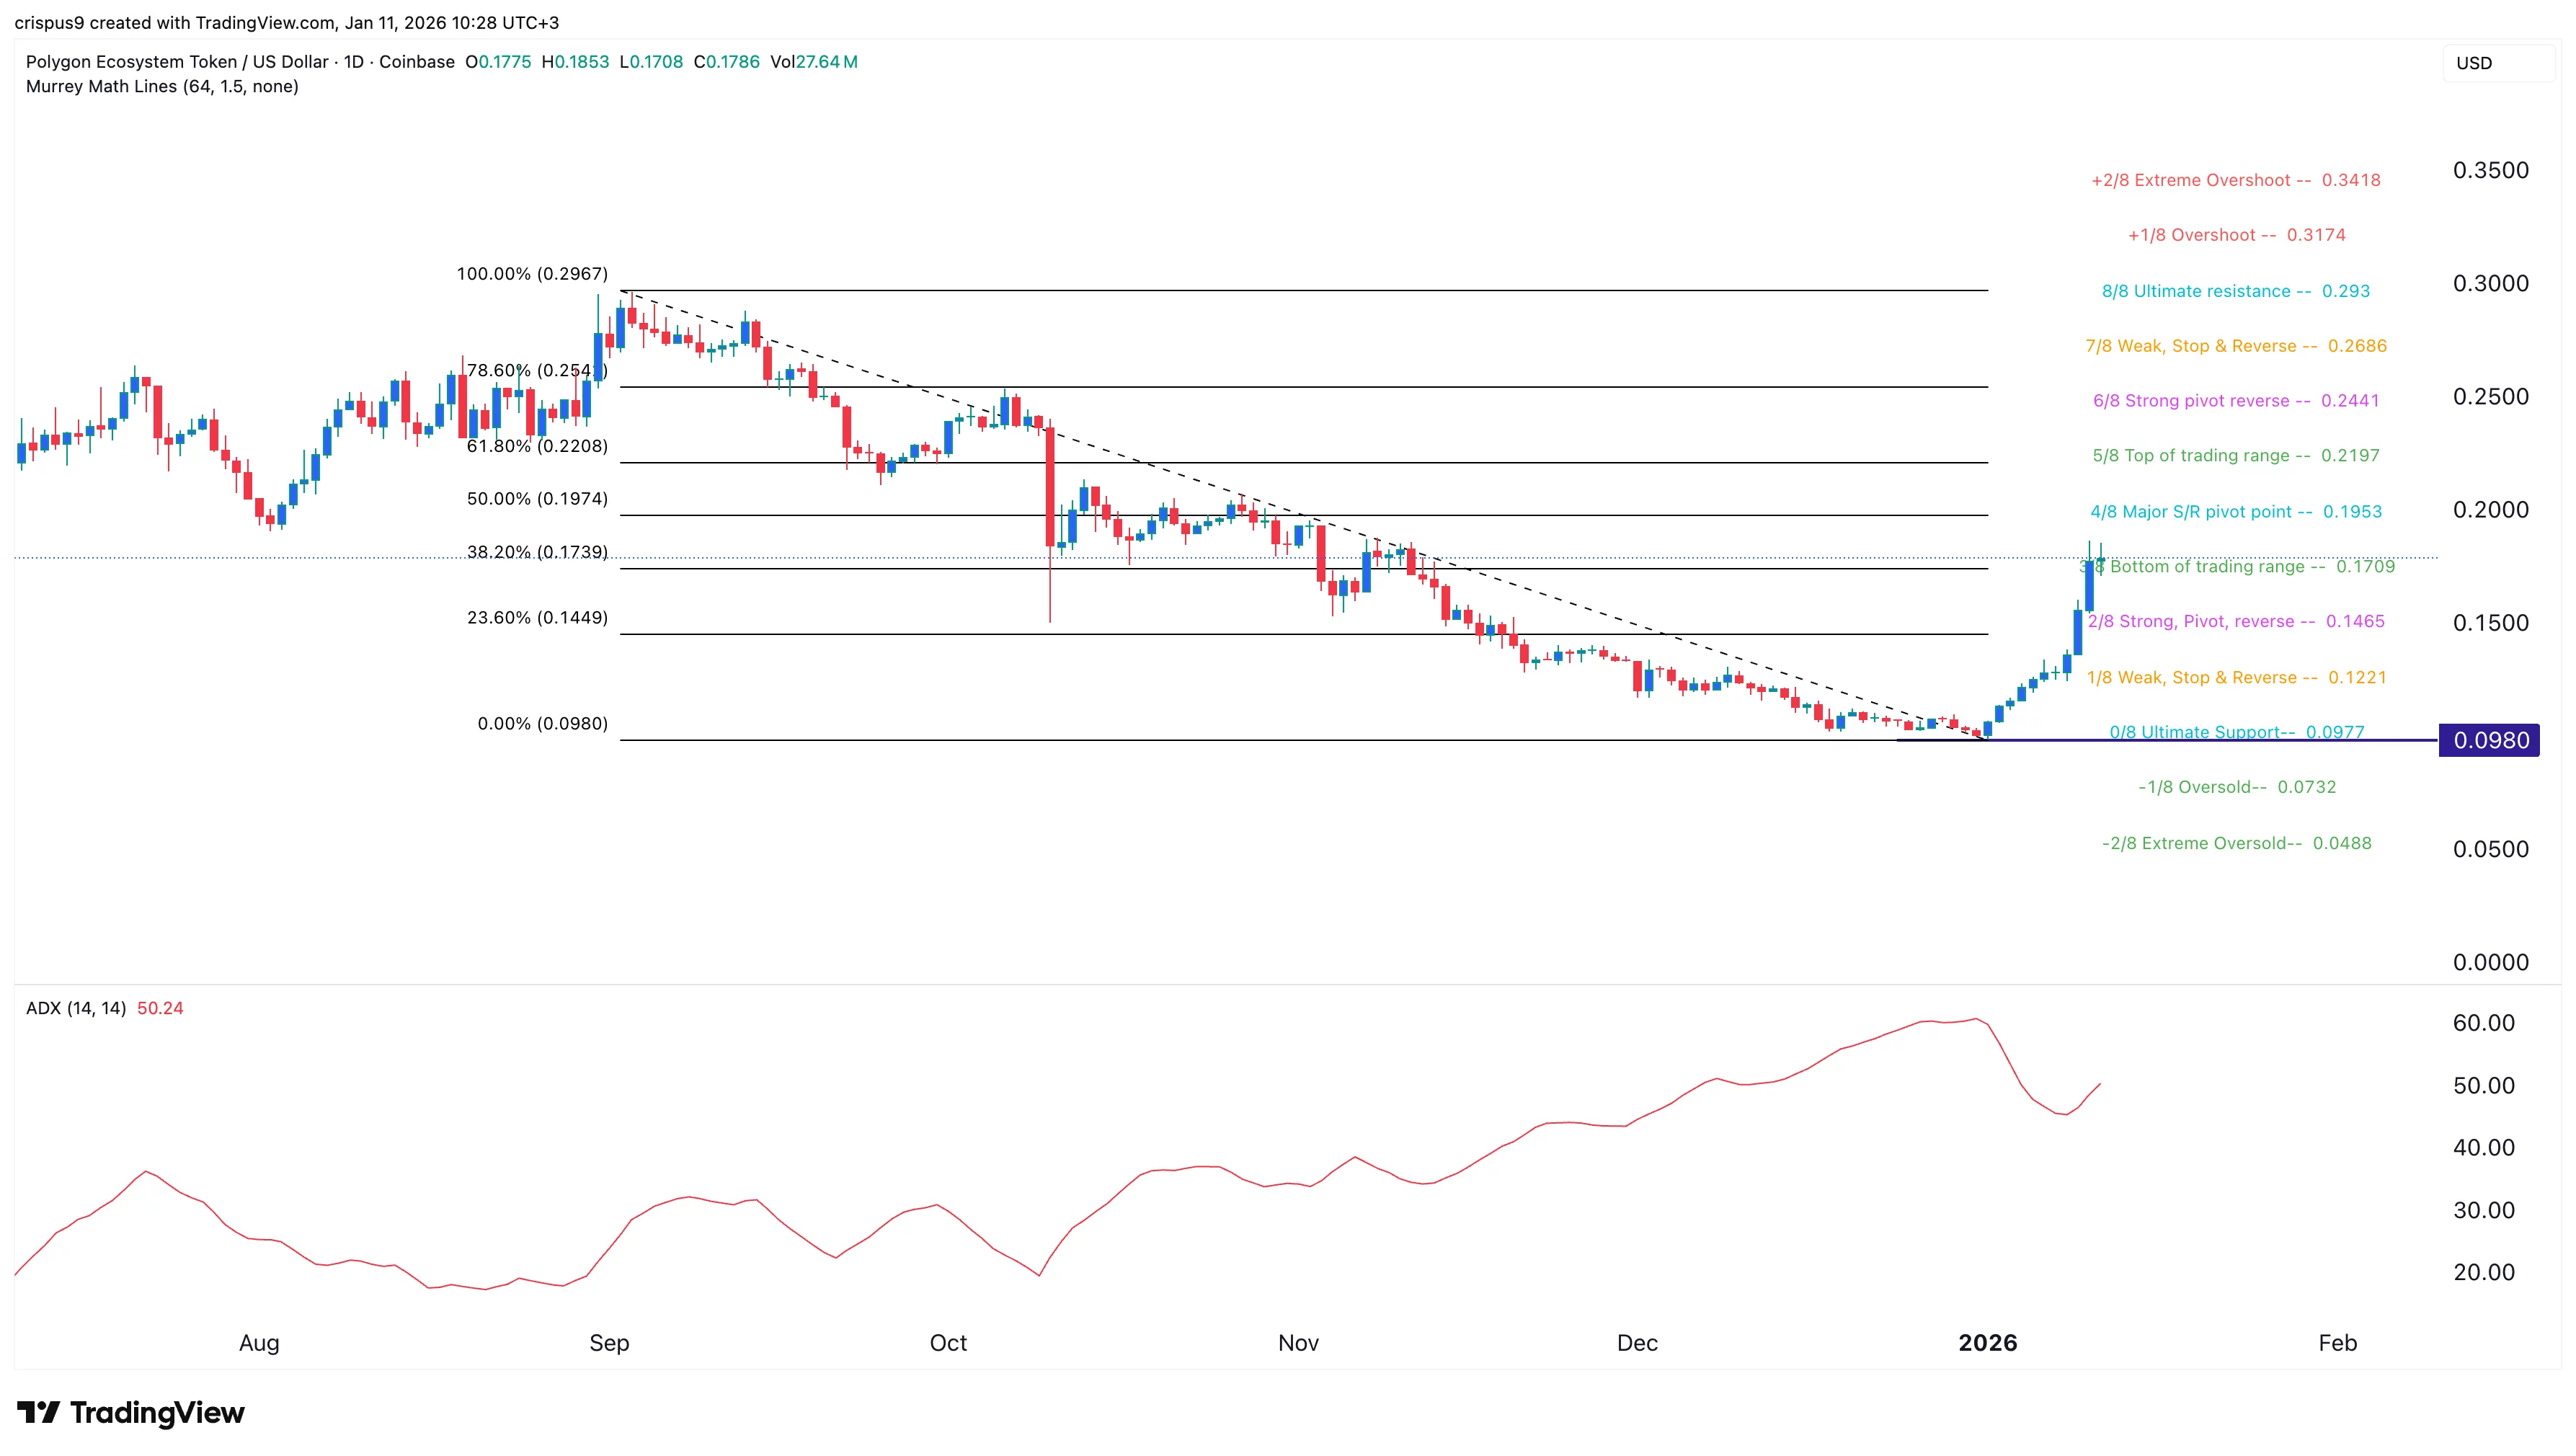
The daily timeframe chart shows that the POL price has rebounded in the past few weeks, moving from a low of $0.098 on January 1 to a high of $0.18.
It has moved above the 38.2% Fibonacci Retracement level and the bottom of the trading range of the Murrey Math Lines tool. It remains above the 50-day and 100-day Exponential Moving Averages.
The Average Directional Index has remained above 50, a sign that the trend is strengthening. Therefore, the most likely scenario is where it continues rising as bulls target the key resistance level at $0.20, which is slightly above the major S/R pivot point of the Murrey Math Lines tool.
However, a drop below the key support level at $0.1500 will invalidate the bullish outlook.


