


The question dominating trader sentiment today is simple: why is the crypto market crashing, and whether Bitcoin can hold the line after a brutal multi-week correction. As of late November 2025, BTC USD has dropped from its $126,000 ATH to lows near $80K, wiping out more than $600Bn in market value.
With the BTC price currently hovering around $87K, Bitcoin crypto sentiment has swung into extreme fear, and traders are anxiously debating whether this significant support will hold or whether a deeper downturn is coming.
Will Bitcoin Hold Support? Key Levels to Watch Now
Bitcoin’s latest rejection from the $90-$92K zone has forced the market to examine the next critical support. After the sharp sell-off, BTC price touched the $80K range, a psychological barrier and a previously tested support level. The difference this time is that last time it acted as support above the 200 EMA and SMA band, continuing the trend, but this time the trend is broken.
This gives us reason to think this could be a “dead cat bounce,” and we should be careful unless obvious signs appear.
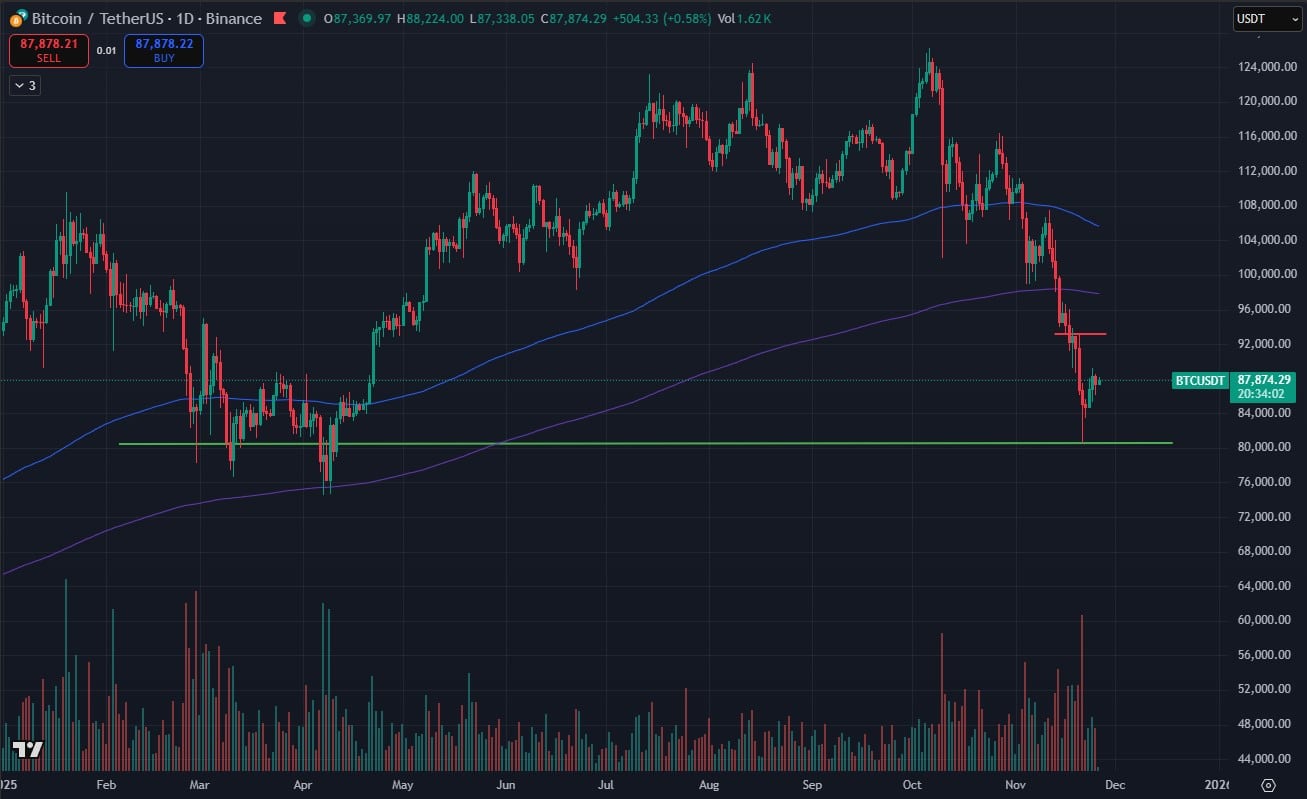
(Source – TradingView)
Some analysts call this the bottom despite the potential for BTC to rebound to $110K. The long-term trendline, which stretches back to 2013, continues to hold, reinforcing the idea that BTC remains in a macro uptrend despite short-term weakness.
However, risk remains high. A decisive break below $80K opens the door to deeper support around. $69K-$62 support channel, corresponding with the previous ATH and the 200 EMA and SMA on the weekly time frame.
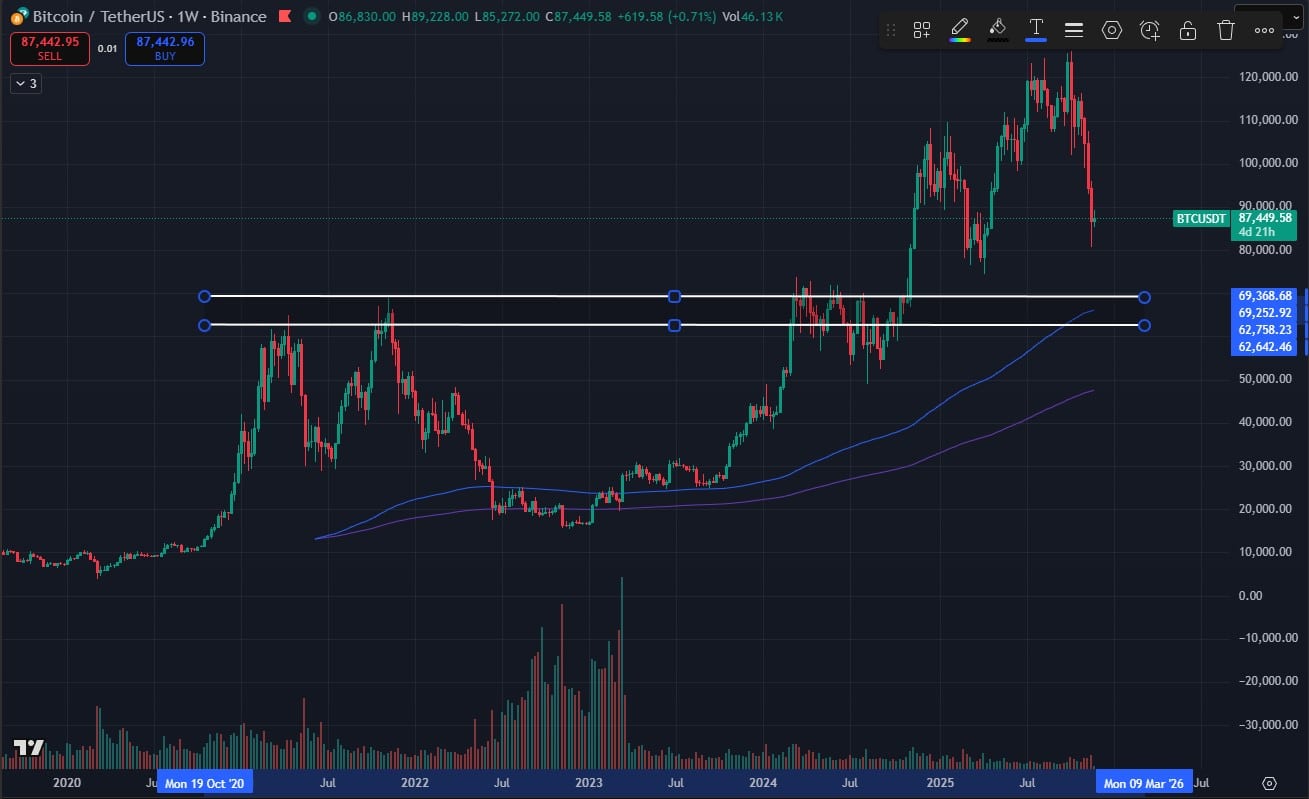
(Source – TradingView)
The community, on the other hand, is split. Half see a generational bottom, and the other half see a breaking of a long-built uptrend calling for the beginning of a bear market. But let’s see what the reasons behind this recent uncertainty are.
DISCOVER: 16+ New and Upcoming Binance Listings in 2025
#1: Hawkish Federal Reserve Kills Risk Appetite
The most significant driver behind the crash is macroeconomic: expectations for rate cuts collapsed. Although the FED cut rates twice, things slowed down, and those same rate cuts were already priced in.

(Source – TradingEconomics)
On top of that, earlier in November, markets priced in a 90% chance of a December rate cut, but hotter-than-expected inflation data forced the Federal Reserve to reverse course. Alongside the U.S. shutdown, which resulted in no October data release and caused mayhem in markets, there was a lot of speculation about hiding bad data.

(Source – TradingEconomics)
This macro reversal triggered a larger risk-off rotation, with capital fleeing crypto into bond and cash markets and defensive assets. Ultimately, Bitcoin’s decline mirrored the sudden collapse in expectations for easier monetary conditions.
DISCOVER: 15+ Upcoming Coinbase Listings to Watch in 2025
#2: Instituional Outflow + Leverage Cascade
Institutional flows flipped aggressively bearish during the sell-off. Bitcoin ETFs that had been accumulating BTC earlier in the year saw $3.5Bn in outflows, pushing spot prices lower. At the same time, the derivatives market entered a liquidation vortex.
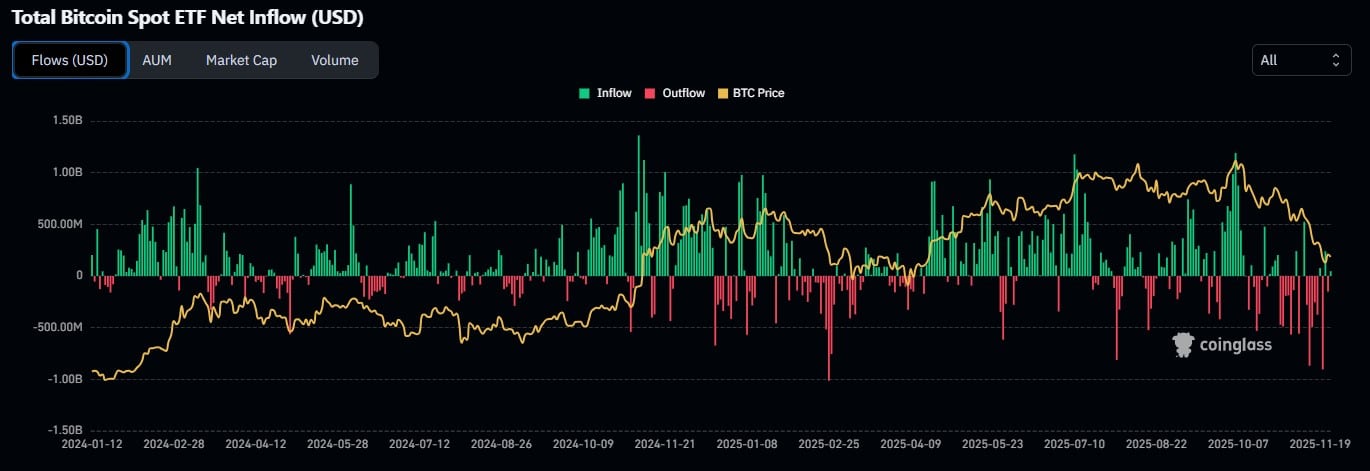
(Source – CoinGlass)
More than $20Bn in leveraged positions were wiped out singlehandedly on October 10, 2025, alone. Funding rates reset violently, and long-term holders sold over 815,000 BTC in a 30-day window, adding supply at the worst possible moment.
With buyers waiting for clearer macro signals, order books thinned, amplifying intraday volatility. This leverage washout is typical after parabolic rallies, but its speed shocked even seasoned traders.
DISCOVER: 10+ Next Crypto to 100X In 2025
#3: Macro Liquidity Tightening and Systemic Stress
It is like a chain reaction, following one after another, and macroeconomics and geopolitics add extra stress to global liquidity. Even though liquidity exists, much of it is “pre-allocated” toward government debt refinancing, higher Treasury yields, and the booming AI sector. Crypto is being squeezed out as liquidity rotates elsewhere.
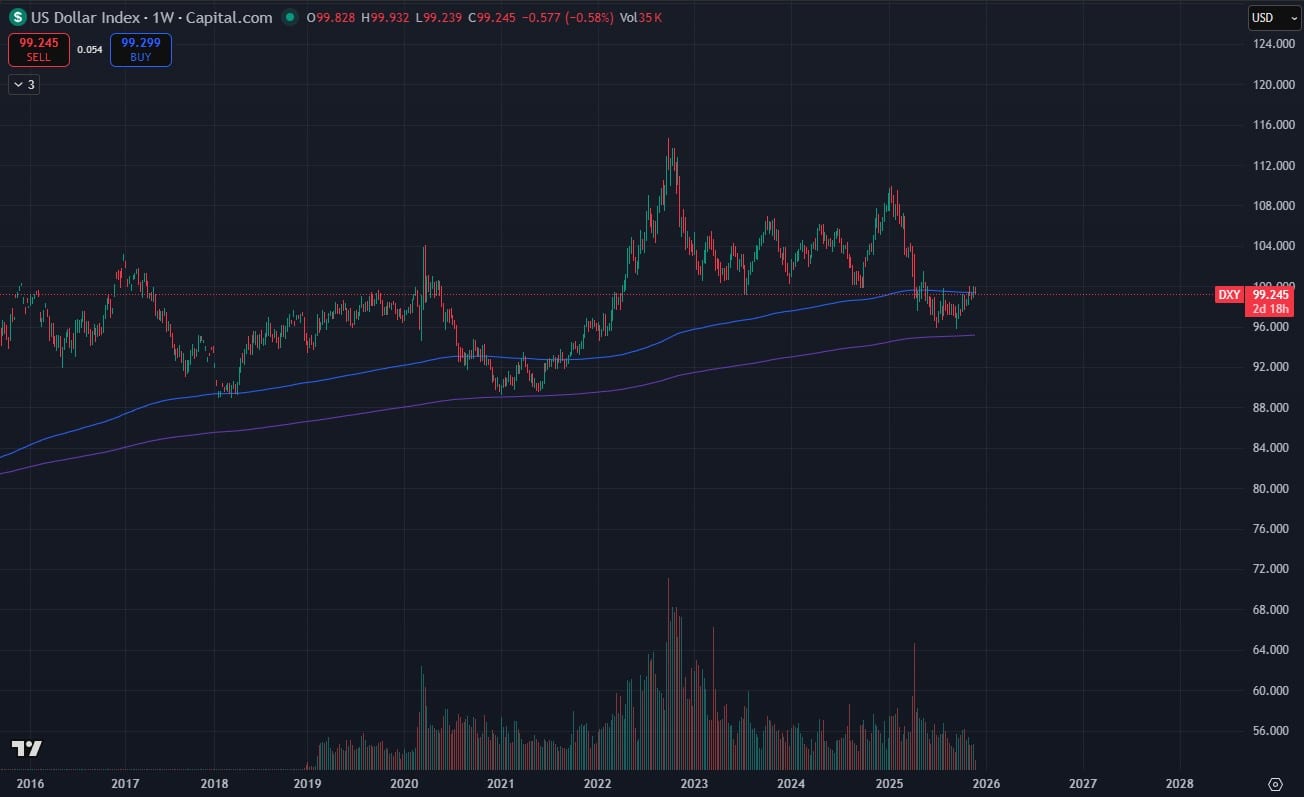
(Source – TradingView)
U.S. Quantitative Tightening, swelling Treasury General Account balances, and a rising dollar all pulled capital into safer-yielding instruments like T-bills at 4-5%. For many macro funds, the opportunity cost of holding Bitcoin became too high.
The DXY chart also suggests the dollar is at the bottom, poised to reverse from a major support band that often weakens Bitcoin. Still, many note that after a big rally like Bitcoin’s, a 30% correction is historically typical. Bitcoin’s fundamentals remain intact. For long-term investors, the structure resembles a necessary, if painful, reset before the next significant move.
DISCOVER: 20+ Next Crypto to Explode in 2025
Join The 99Bitcoins News Discord Here For The Latest Market Updates
Key Takeaways
The post Will Bitcoin Price Hodl Support? BTC USD Price Prediction, 3 Reasons Why The Crypto Market is Crashing Explained appeared first on 99Bitcoins.


