


XRP price is slowly forming a giant hammer candlestick pattern, pointing to an eventual rebound, as Ripple prepares the launch of its permissioned DEX features to the network.
Summary
- XRP price has dropped in the last five consecutive weeks as the crypto market crash accelerated.
- Ripple plans to launch its permissioned DEX tool that will boost the XRP utility soon.
- Technical analysis suggests that it has formed a hammer candlestick pattern on the weekly chart.
Ripple (XRP) token was trading at $1.4120, up by 25% above its lowest level this week, matching the performance of other top tokens like Ethereum, Bitcoin, and Solana.
XRP’s rebound happened after the developers published the roadmap for bringing institutional decentralized finance (DeFi) with XRP token at the core of the network.
The team launched permissioned domains, which enable regulated environments, where access is controlled by Credentials, which enable KYC and AML tools in the network.
It will now launch Permissioned DEX tools, which will build on permissioned domains by allowing secondary markets for forex and stablecoins. All these features will leverage the use of Ripple USD (RLUSD), which will settle on the XRPL network.
Every transaction on the decentralized exchange will burn XRP token, reducing its supply. This will happen at a time when the XRP burn rate has dwindled in the past few months. In a note, Messari noted that the network has burned 14.3 million XRP tokens since inception, a low burn it attributed to its low transaction fee.
Meanwhile, XRP ETFs managed to score inflows this week despite the crypto market crash. Its ETFs added over $39 million in assets this week, while Bitcoin and Ethereum continued their outflows.
XRP price technical analysis
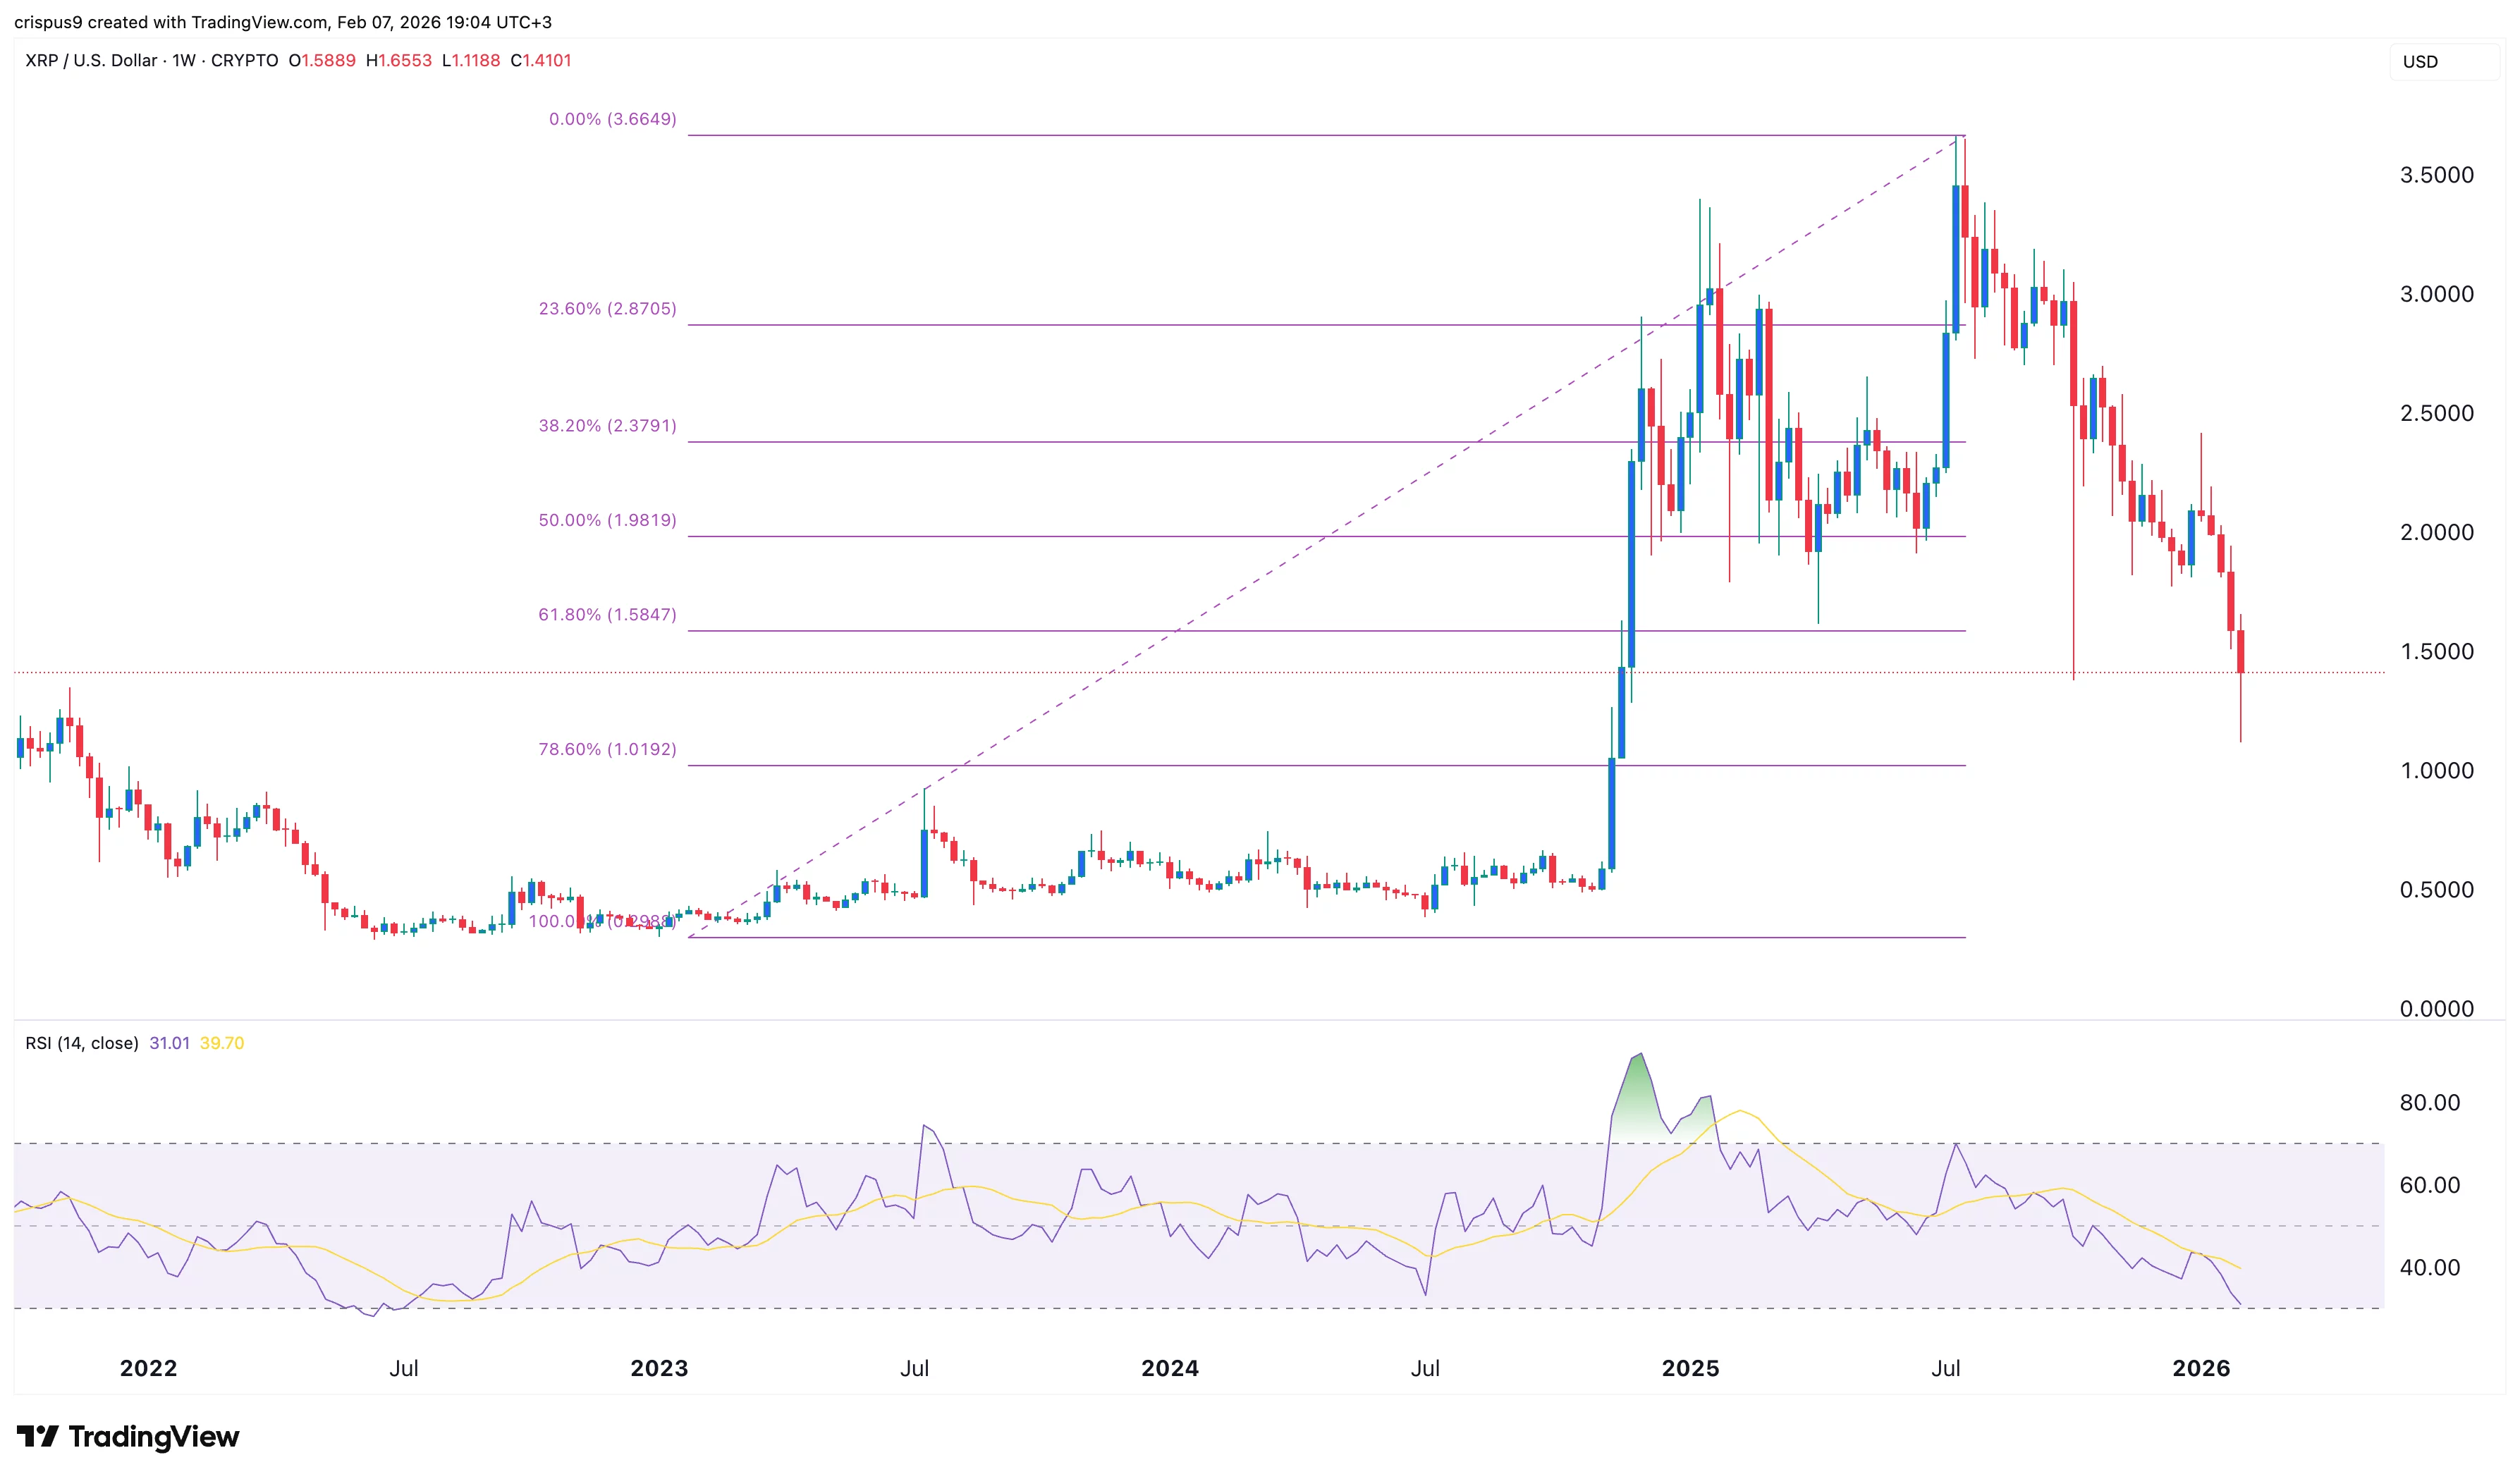
The weekly chart shows that the XRP token price has retreated sharply in the past few months. It retreated in the last five consecutive weeks and is now nearing its lowest level since November 2024.
The coin has constantly remained below all moving averages and the 61.8% Fibonacci Retracement level.
On the positive side, the Relative Strength Index is nearing the oversold level at 30. It has also formed a hammer candlestick pattern, which happens when it has a small body and a long lower shadow. A hammer is one of the most common bullish reversal sign.
Therefore, there is a possibility that the token will rebound in the coming weeks as investors buy the dip. If this happens, the next key target to watch being the psychological level at $2.0. However, a drop below the key support level at the $1.1210 will invalidate the bullish outlook and point to more downside.


")