


Dogecoin iis showing clear signs of a structural market shift after months of grinding within bearish conditions. A strong breakout followed by bullish confirmations suggests that a deeper upside continuation could be underway, if key support levels hold. Momentum indicators are aligning, technical structure is shifting, and buyers are gradually regaining control.
Despite recent volatility in the broader crypto market, Dogecoin (DOGE) has quietly been laying the groundwork for a significant trend reversal. After breaking free from a long-standing bearish trend, DOGE surged into high-timeframe resistance at $0.23 before facing rejection. Importantly, the pullback didn’t result in a full breakdown, but rather a rotation into critical support, which appears to be holding firm. This price behavior, supported by volume dynamics and key indicators, signals strength rather than weakness.
Key technical points
- Major Market Structure Break: DOGE has broken out of a prolonged bearish structure, initiating a trend shift with an impulsive rally to $0.23.
- Critical Support at $0.16: Price is now rotating into a high timeframe support zone backed by the 0.618 Fibonacci and Point of Control.
- 200-Day Moving Average Retest: A bullish candle close above the 200 MA, followed by a successful retest, confirms strength in the current move.
- Stochastic RSI in Oversold Region: Currently at 19, this is a historically reactive level. A bullish crossover and move above 20 often precede momentum shifts.
- Bullish Continuation Signal: Constructive price action within the support cluster would set up an ideal long entry model for a move toward the previous high at $0.23 and beyond.

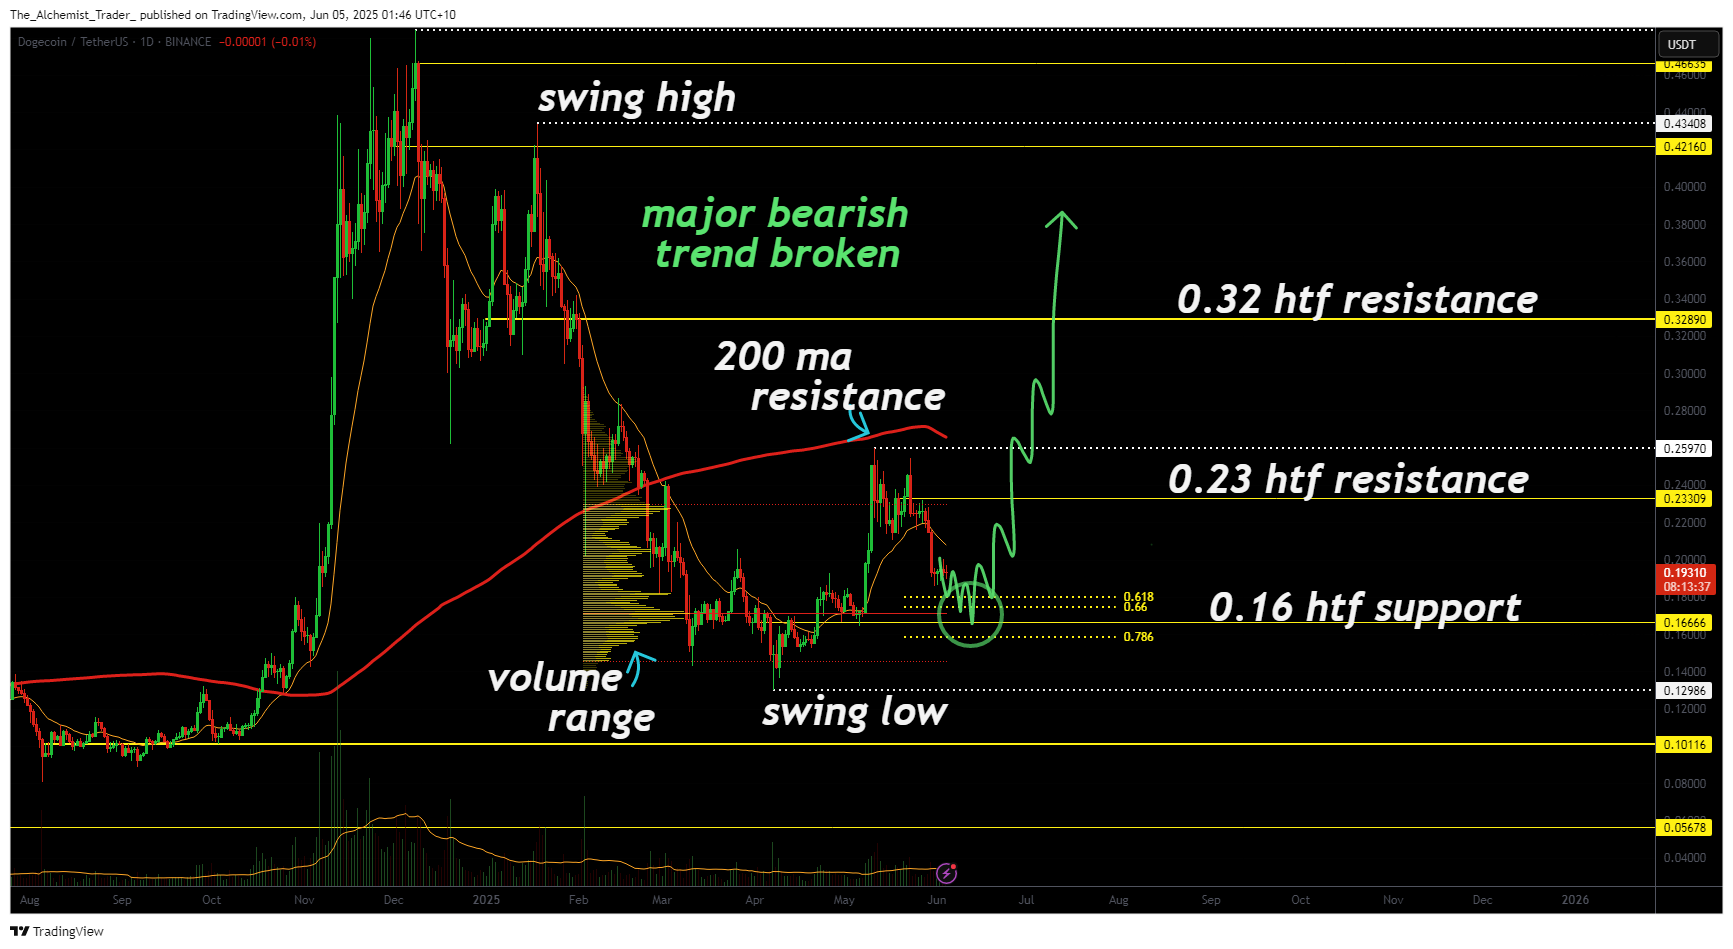
The breakout from Dogecoin’s entrenched bearish structure is more than just a short-term anomaly, it carries deeper implications. The impulsive breakout candle surged into $0.23 resistance, a level that has historically been a pivot zone for DOGE’s macro behavior. The recent rejection from this area resembles a healthy correction, not a failure of trend.
More critically, the move marked a clear shift in structure: higher highs, a confirmed 200-day MA retest, and a developing bullish Stochastic RSI setup all point toward potential continuation. DOGE is consolidating within a cluster of support zones, and if these levels hold, a new leg up could retest prior swing highs and possibly kick off a broader uptrend.
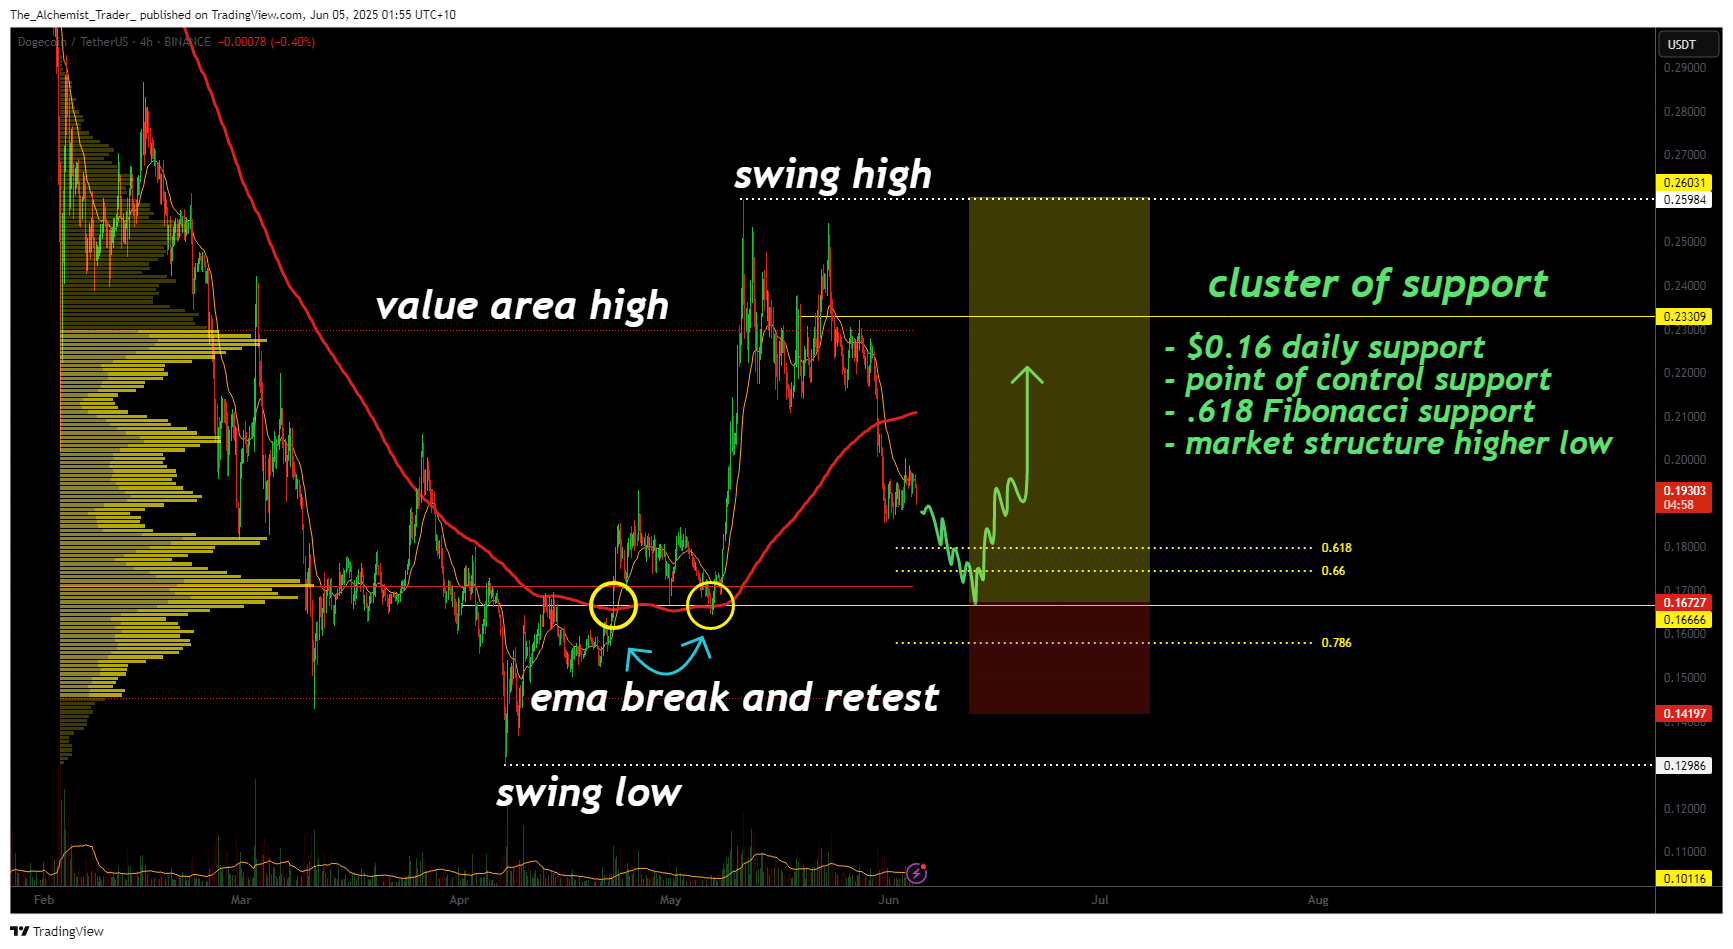
The most important aspect of the current price action is the retest zone around $0.16. This level holds substantial weight as it combines several layers of technical confluence: the 0.618 Fibonacci retracement, the Point of Control from volume profile data, and a dynamic market structure higher low region. From a trader’s perspective, when these technical indicators align, it creates a high-probability zone for a bullish reversal or continuation.
Adding weight to the bullish thesis is the behavior around the 200-day moving average. Dogecoin recently printed a full candle close above the 200 MA, a feat that hasn’t occurred with such conviction in months. What followed was a textbook bullish retest, where price retraced, tagged the moving average, and immediately rebounded, establishing a new swing high above the value area. This is a strong signal of accumulation beneath resistance and suggests that buyers are gradually overpowering distribution.
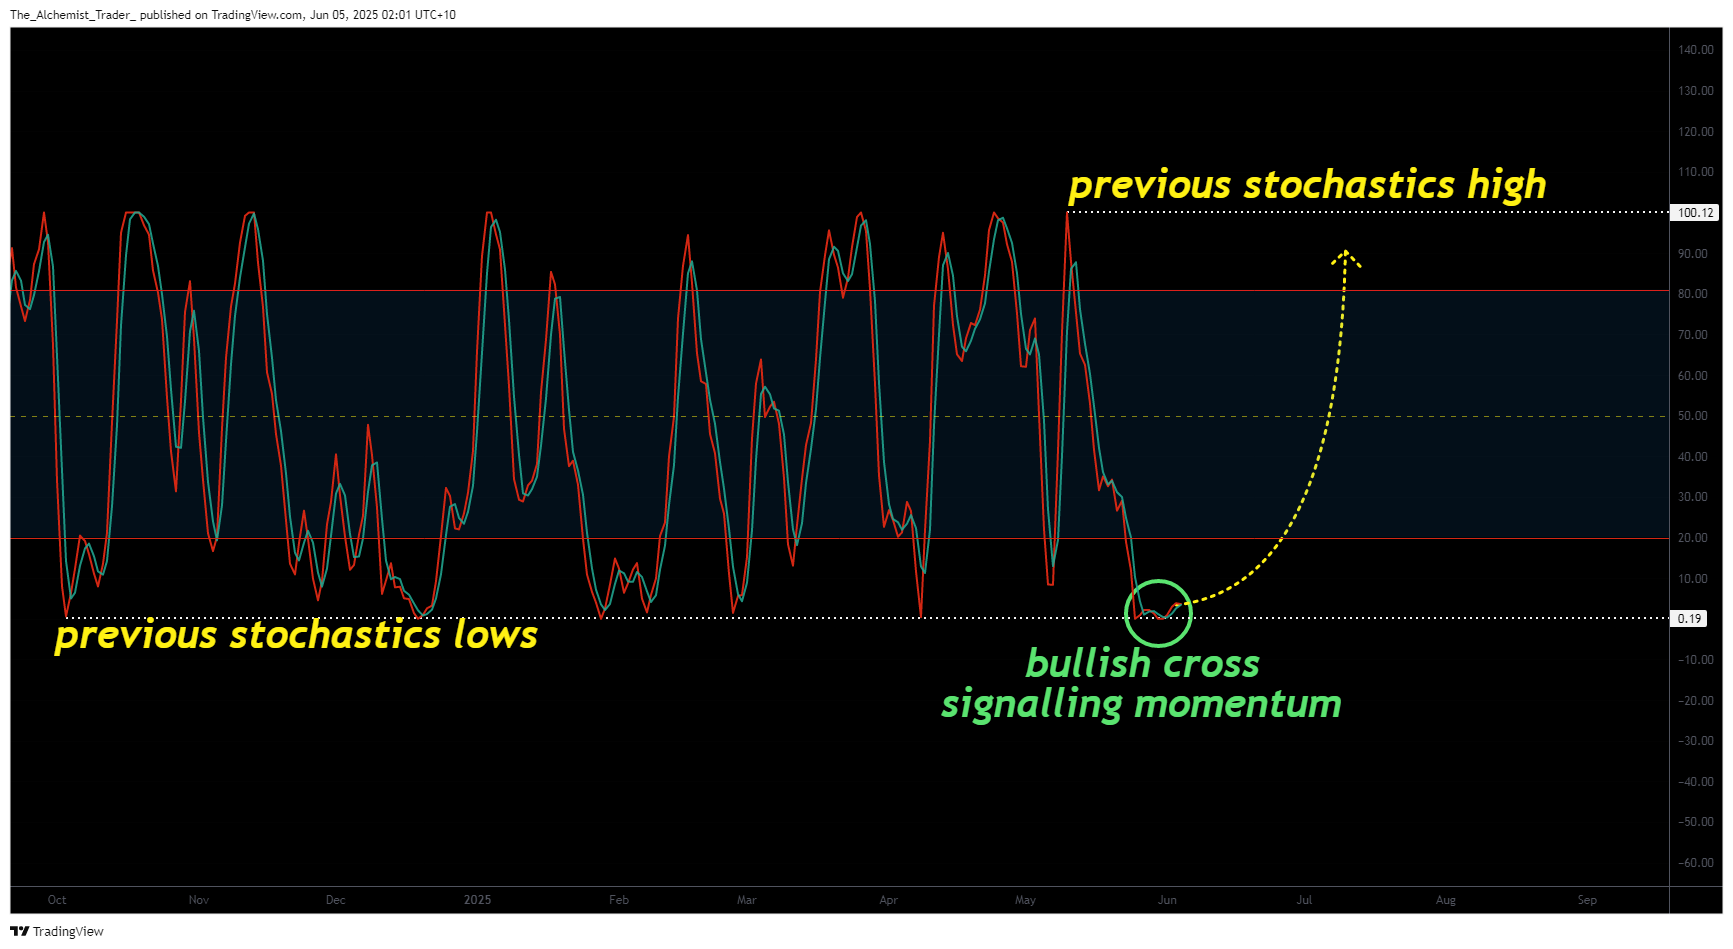
From a momentum standpoint, the Stochastic RSI is flashing a highly relevant signal. Currently sitting around 19, DOGE is in an extremely oversold territory, a region where historical reversals have initiated. The key element here is not just the value, but the bullish crossover that is currently developing. If the stochastic crosses above the 20 line, momentum confirmation occurs, and in past cycles, this has correlated strongly with explosive upside moves. In short, the momentum reset appears complete, and conditions are ripe for reacceleration.
Moreover, price action is not showing weakness despite its correction from the $0.23 level. On the contrary, it is respecting support and consolidating constructively, this is evident through multiple daily closes above the $0.16 level. If this cluster holds and structure remains intact, a new bullish leg toward $0.23 becomes the base case. And beyond that? The lack of resistance between $0.23 and $0.30 opens the door to a more significant continuation.
What to expect in the coming price action
The next few days are critical for Dogecoin. A sustained defense of the $0.16 support cluster, particularly around the POC and 0.618 Fib, would set up the conditions for a long trade entry, targeting a return to the recent swing high at $0.23. If that level breaks, a quick acceleration toward $0.30 is likely.
Momentum confirmation via the Stochastic RSI crossover above 20 will be a key secondary signal. If both support holds and momentum confirms, DOGE could be entering a new phase of its market cycle, one where higher lows, trend continuation, and increasing volume characterize the next leg.
Traders should focus on how price behaves around the support cluster, monitor candle structure on the daily timeframe, and watch for confirmation from momentum indicators like the Stochastic RSI. While a failed hold below $0.16 would invalidate this setup, current conditions favor bullish continuation and a potential macro trend reversal.


