


Is $170,000 still a valid projection when Bitcoin derivatives show concentrated open interest at $140,000, or is the market setting itself up for another correction?
Softer CPI data fuels BTC recovery attempt
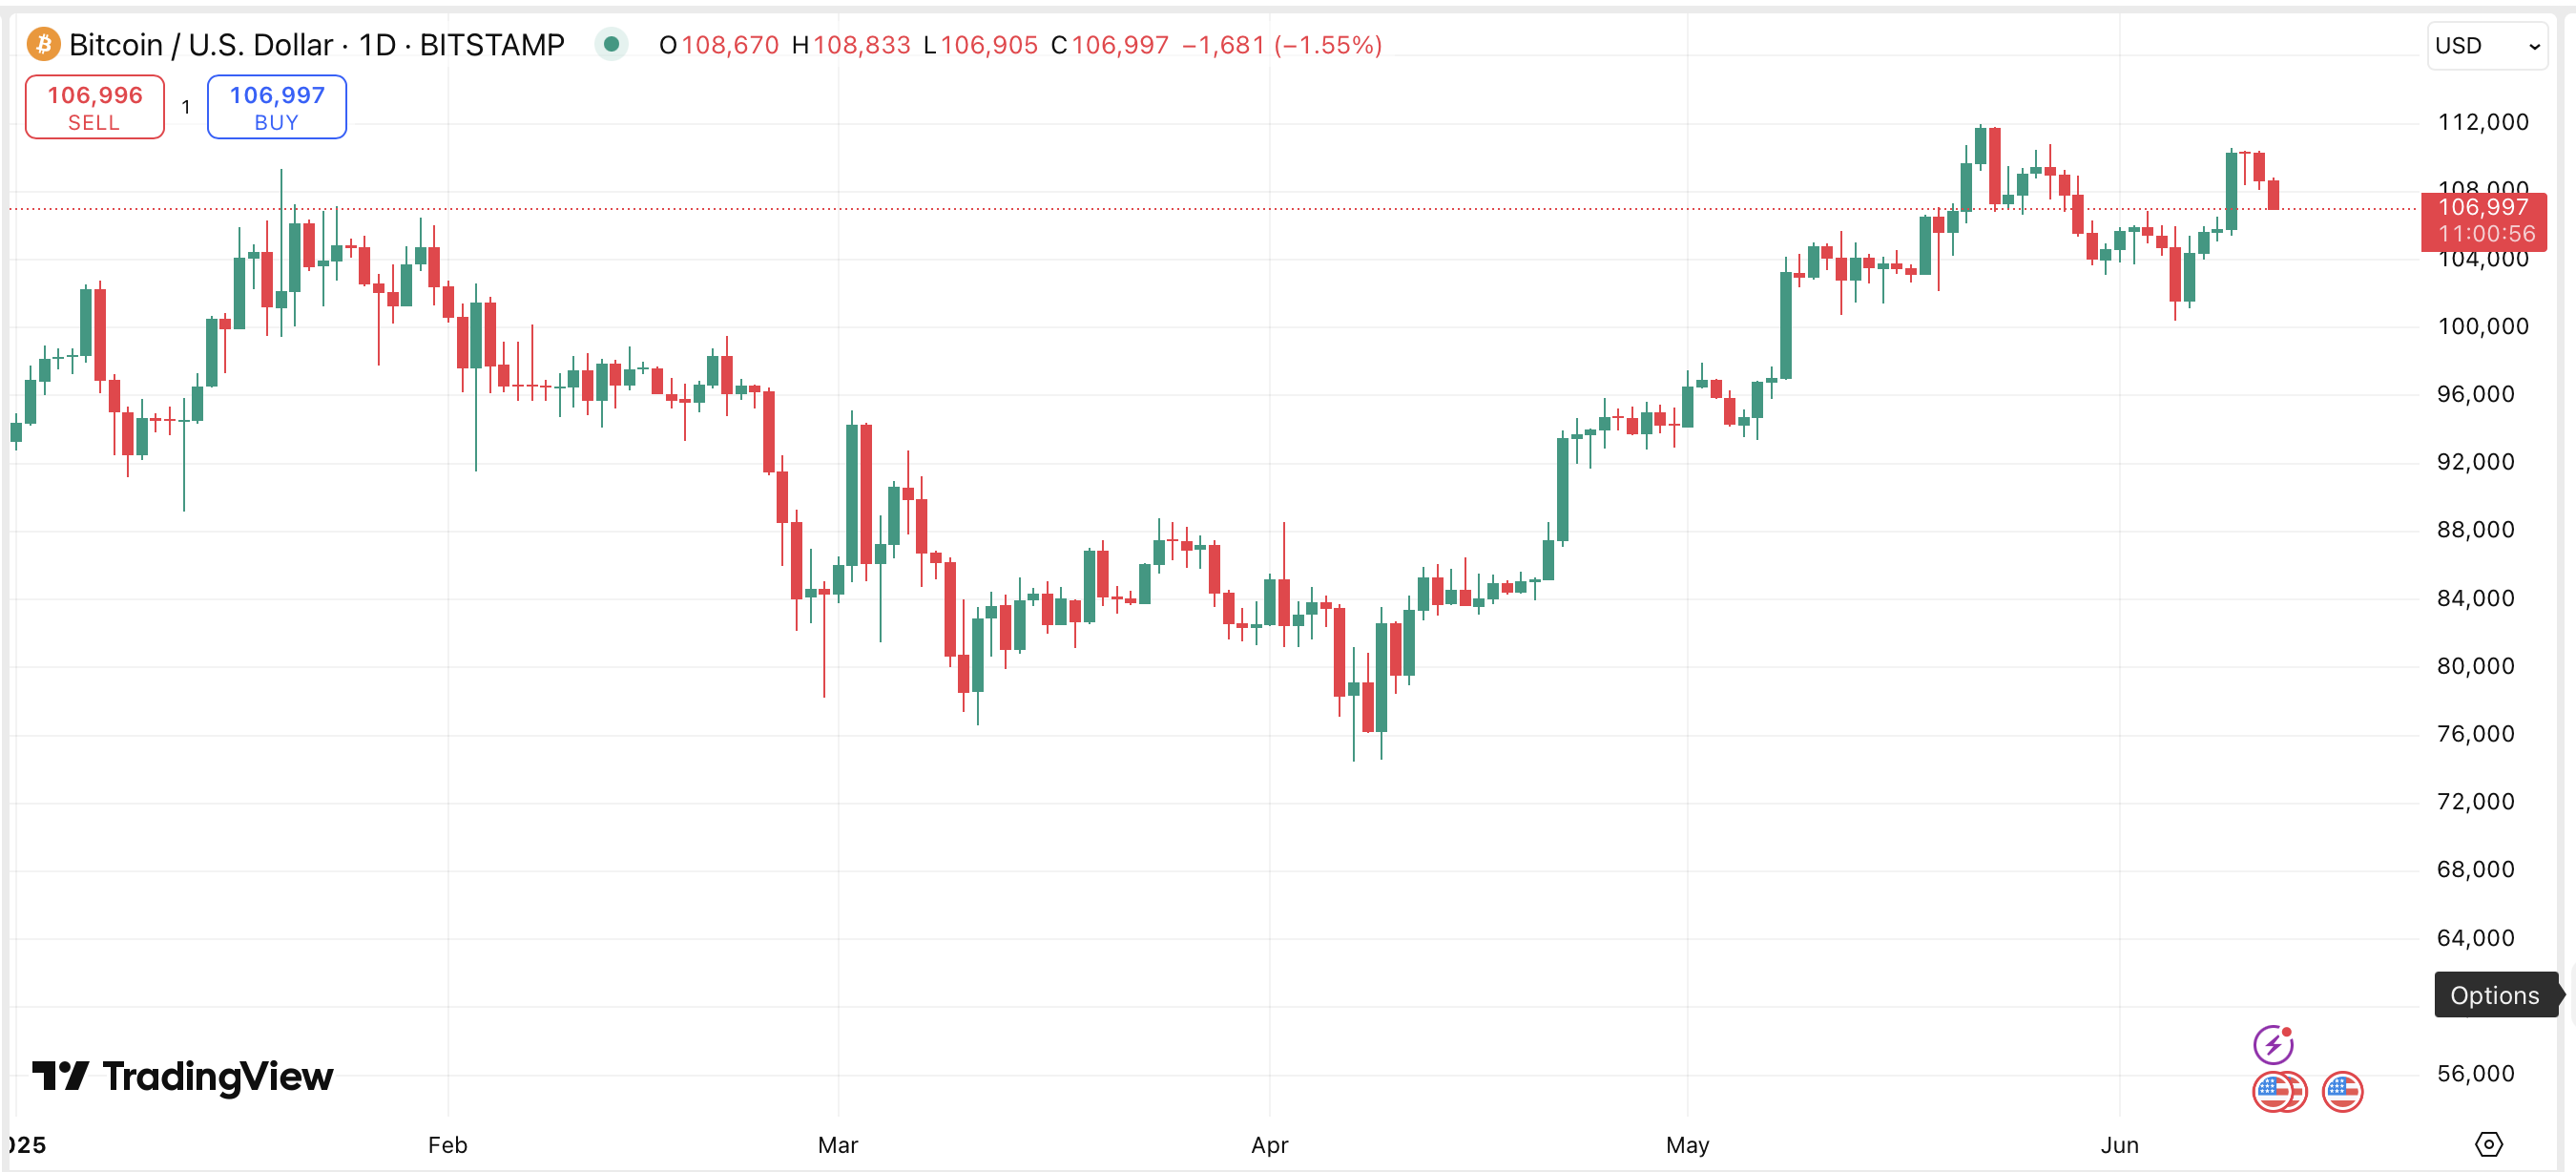
Bitcoin (BTC) climbed to $110,400 on Jun. 11 after fresh U.S. inflation data showed prices rising at a slower pace than expected. The report raised hopes that the Federal Reserve may have more room to lower interest rates in the coming months, a potential tailwind for risk assets including BTC.
As of Jun. 12, Bitcoin is trading near $107,000. That’s about 4.5% below its all-time high of $111,970 reached on May 22.

Investor sentiment has also shifted. The Crypto Fear & Greed Index currently sits at 71, placing the market in the “greed” category.
Meanwhile, social media data from Santiment shows 2.12 positive Bitcoin mentions for every negative one, marking the highest ratio since November 2024. At the time, Bitcoin had crossed $70,000 shortly after Donald Trump won the U.S. presidential election.
Institutional flows have grown as well. Total assets in Bitcoin ETFs rose from $91 billion in April to $132 billion in June, a 45% increase in two months, pointing to sustained demand from large investors.
With Bitcoin price activity, sentiment, and institutional positioning all showing upward movement, new models such as the Golden Curves and Sine Wave forecasts are gaining attention.
Let’s understand the math behind the optimism, revisit historical cycle behaviors, and assess if buying Bitcoin now offers a favorable risk-reward setup.
Middle East risks redirect capital toward gold
Bitcoin’s recent pullback points to a combination of macroeconomic developments and geopolitical stressors that are introducing short-term uncertainty.
U.S. inflation remains contained, with core consumer prices holding steady at 2.8%. That has led to increased expectations of interest rate cuts later this year. According to the CME FedWatch Tool, most traders are now pricing in two potential cuts starting in September.
A lower interest rate environment typically reduces the appeal of the U.S. dollar and fixed-income assets, giving risk-on markets like crypto more space to perform. However, those expectations are being tested by current global events.
In the Middle East, escalating tensions are starting to impact capital flows. The U.S. is relocating personnel from parts of the region amid security concerns, while Israel’s reported plans regarding Iran have attracted renewed international attention.
Earlier today, the International Atomic Energy Agency stated that Iran has violated its nuclear obligations for the first time in two decades.
As a result, investors have shifted some capital into traditional safe havens, with gold prices rising over 1.5% in the last 24 hours to $3,375 per ounce.
Bitcoin has been affected by this repositioning. It is down 1.7% over the same 24-hour period, mirroring risk asset behavior in response to global uncertainty and short-term flight to safety.
Meanwhile, the broader crypto derivatives market remains active. On Deribit, open interest in Bitcoin options has risen to $36.7 billion, the highest level so far this month. The June 27 expiry leads in volume, accounting for $13.8 billion in notional terms.
A significant number of call options remain concentrated at the $140,000 strike price, although the overall put-to-call ratio has adjusted to 0.60, signaling a slightly softer bullish bias than previous sessions.
In futures markets, total open interest across Binance, Bybit, OKX, Deribit, and Hyperliquid has reached $55.4 billion, with Binance alone contributing $23.3 billion, pointing to sustained participation despite near-term volatility.
The U.S. Bureau of Labor Statistics is scheduled to release May’s Producer Price Index data today. Expectations point to a month-over-month increase of 0.3% in core PPI, following a decline of 0.4% in April.
Headline PPI is also forecast to rise 0.2% after last month’s drop of 0.5%. Year-on-year, both core and headline readings are projected to remain steady or move slightly higher.
If confirmed, the rebound in monthly PPI figures could indicate fresh inflationary pressure at the wholesale level, challenging the broader market narrative of cooling inflation. That, in turn, may affect expectations around how soon and how much the Federal Reserve can ease rates.
Predictive models suggest $160K–$170K range still in play
Bitcoin’s short-term direction appears to be hinged on a complex interaction between macro triggers, technical structure, and behavioral signals from larger market participants.
Technical analysts are paying close attention to the $106,000 to $107,000 range. According to trader KillaXBT, this is a key demand zone. He notes that BTC has “rejected local supply” and is attempting to stabilize within this range.
His high time frame (HTF) target remains between $114,000 and $116,000 for the month, but he cautions that “if we lose 106K,” the Bitcoin price may fall to fill a CME futures gap, which would involve testing lower levels before any continuation of trend.
The broader sense from his analysis points to a structured market that is still intact, provided Bitcoin does not breach $100,000 support.
On the behavioral side, on-chain data from CryptoQuant highlights the role of large holders. During prior cycle tops, Binance whales — wallets with over 1,000 BTC — typically increased exchange inflows as prices approached new highs, signaling intent to take profits.
In early 2024, inflows peaked around $5.3 billion and climbed to $8.45 billion and $7.24 billion during earlier rallies. Currently, inflows are down to around $3 billion and trending lower, indicating a preference to hold rather than distribute.
The pattern signals that many large holders are not yet ready to exit and may be positioning for higher levels ahead.
Sentiment models also point to possible future upside, though with varying levels of confidence. The Golden Diminishing Curves model, shared by CryptoCon, places the next cycle top between $160,000 and $170,000.
The model’s upper cycle band labeled as “+2” has not been reached yet, suggesting that the current cycle still has room to develop.
CryptoCon described the setup as a “ticking time bomb,” but the data itself simply illustrates that past cycle tops followed a clear curve pattern that has not yet been completed in this run.
PlanB, known for his stock-to-flow and RSI-based cycle studies, weighed in with a separate observation. If Bitcoin’s monthly Relative Strength Index retests 75, it would historically align with price levels around $130,000.
He adds that “RSI 75 = ~$130k (June closing price),” suggesting that if momentum continues, such a target is plausible based on prior RSI peaks during bull runs.
Across these perspectives, one common thread is that the structure remains intact, and many indicators are pointing to the possibility of further upside. The $114K–$116K region appears to be a major short-term target.
However, risk still remains. A break below $100K would weaken the bullish structure, and a failure to hold $106K could trigger lower retracements.
The current phase, therefore, is less about euphoric breakout calls and more about managing expectations within clearly defined levels. As always, consult a financial planner before making any investment decisions, trade wisely, and never invest more than you can afford to lose.
Disclosure: This article does not represent investment advice. The content and materials featured on this page are for educational purposes only.


