


Shiba Inu price crashed to a crucial support level this week, but technical indicators and whale accumulation suggest a potential bullish breakout may be on the way.
Shiba Inu (SHIB) was trading at $0.0000115 on Saturday, a few points above this week’s low of $0.000010. It remains 35% below the highest level in May and 65% lower than its November high.
Shiba Inu’s crash has coincided with the performance of most altcoins, with the market capitalization of all cryptocurrencies, excluding Bitcoin (BTC), Ethereum (ETH), and stablecoins, falling from $947 billion in November to $583 billion today.
SHIB has faced numerous internal challenges, including the deteriorating Shibarium ecosystem, increased whale selling, and competition from Solana meme coins like Fartcoin and Dogwifhat.
DeFi Llama data shows that Shibarium’s total value locked has decreased by 20% over the last 30 days, to $2.58 million. Most dApps in the ecosystem, like ShibaSwap, WoofSwap, and ChewySwap, have shed assets in the past 30 days. Its TVL is much smaller than many newer chains like Sui, Sei, and Unichain.
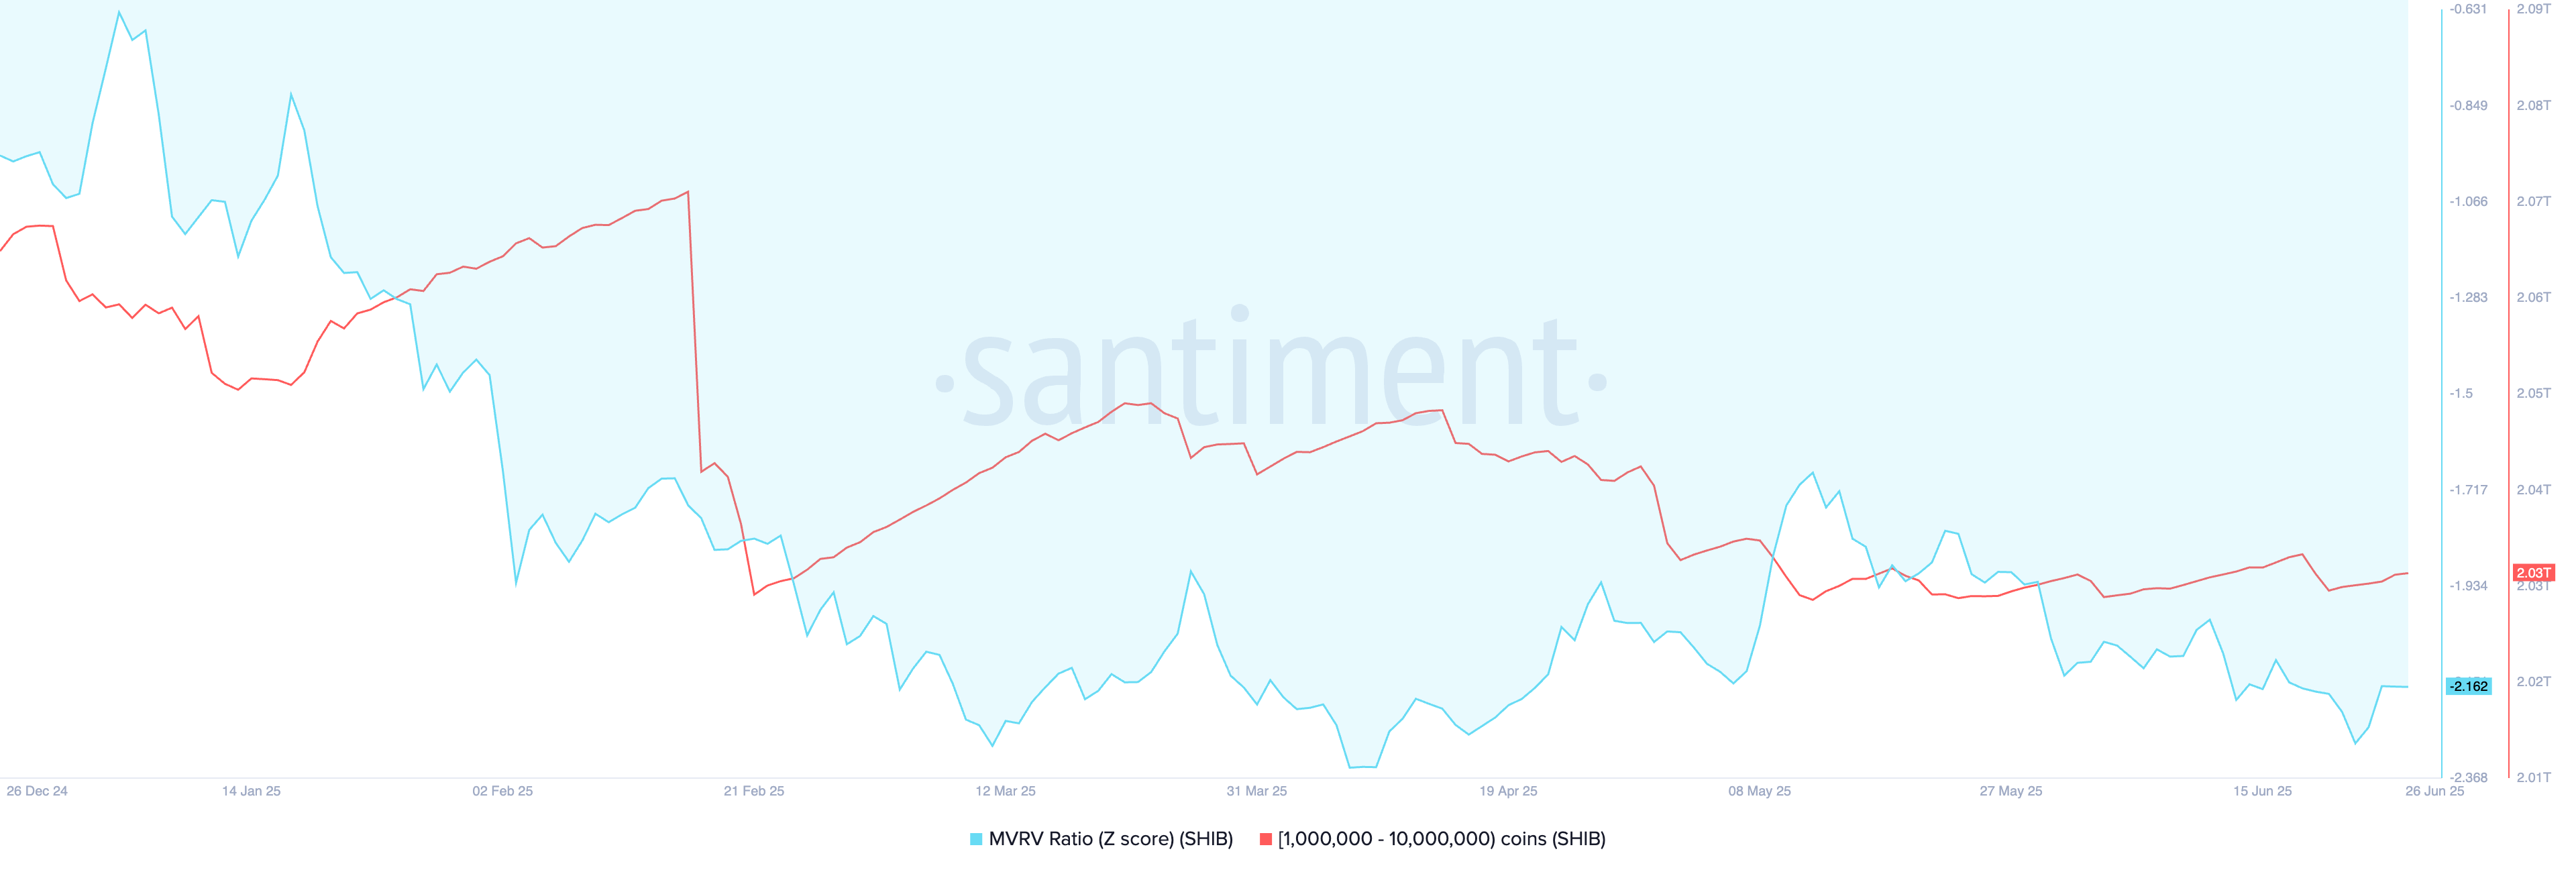
Still, there are a few reasons why SHIB price may bounce back soon. First, after months of selling, there are signs that whales have started buying it. Santiment data shows that holders with between 1 million and 10 million tokens have increased their positions to 2.03 trillion from last month’s low of 2 trillion.
The other reason is that Shiba Inu has become relatively cheap, with an MVRV figure of less than 1 — a sign that it is undervalued, as the market price is lower than its realized value.

Shiba Inu price technical analysis

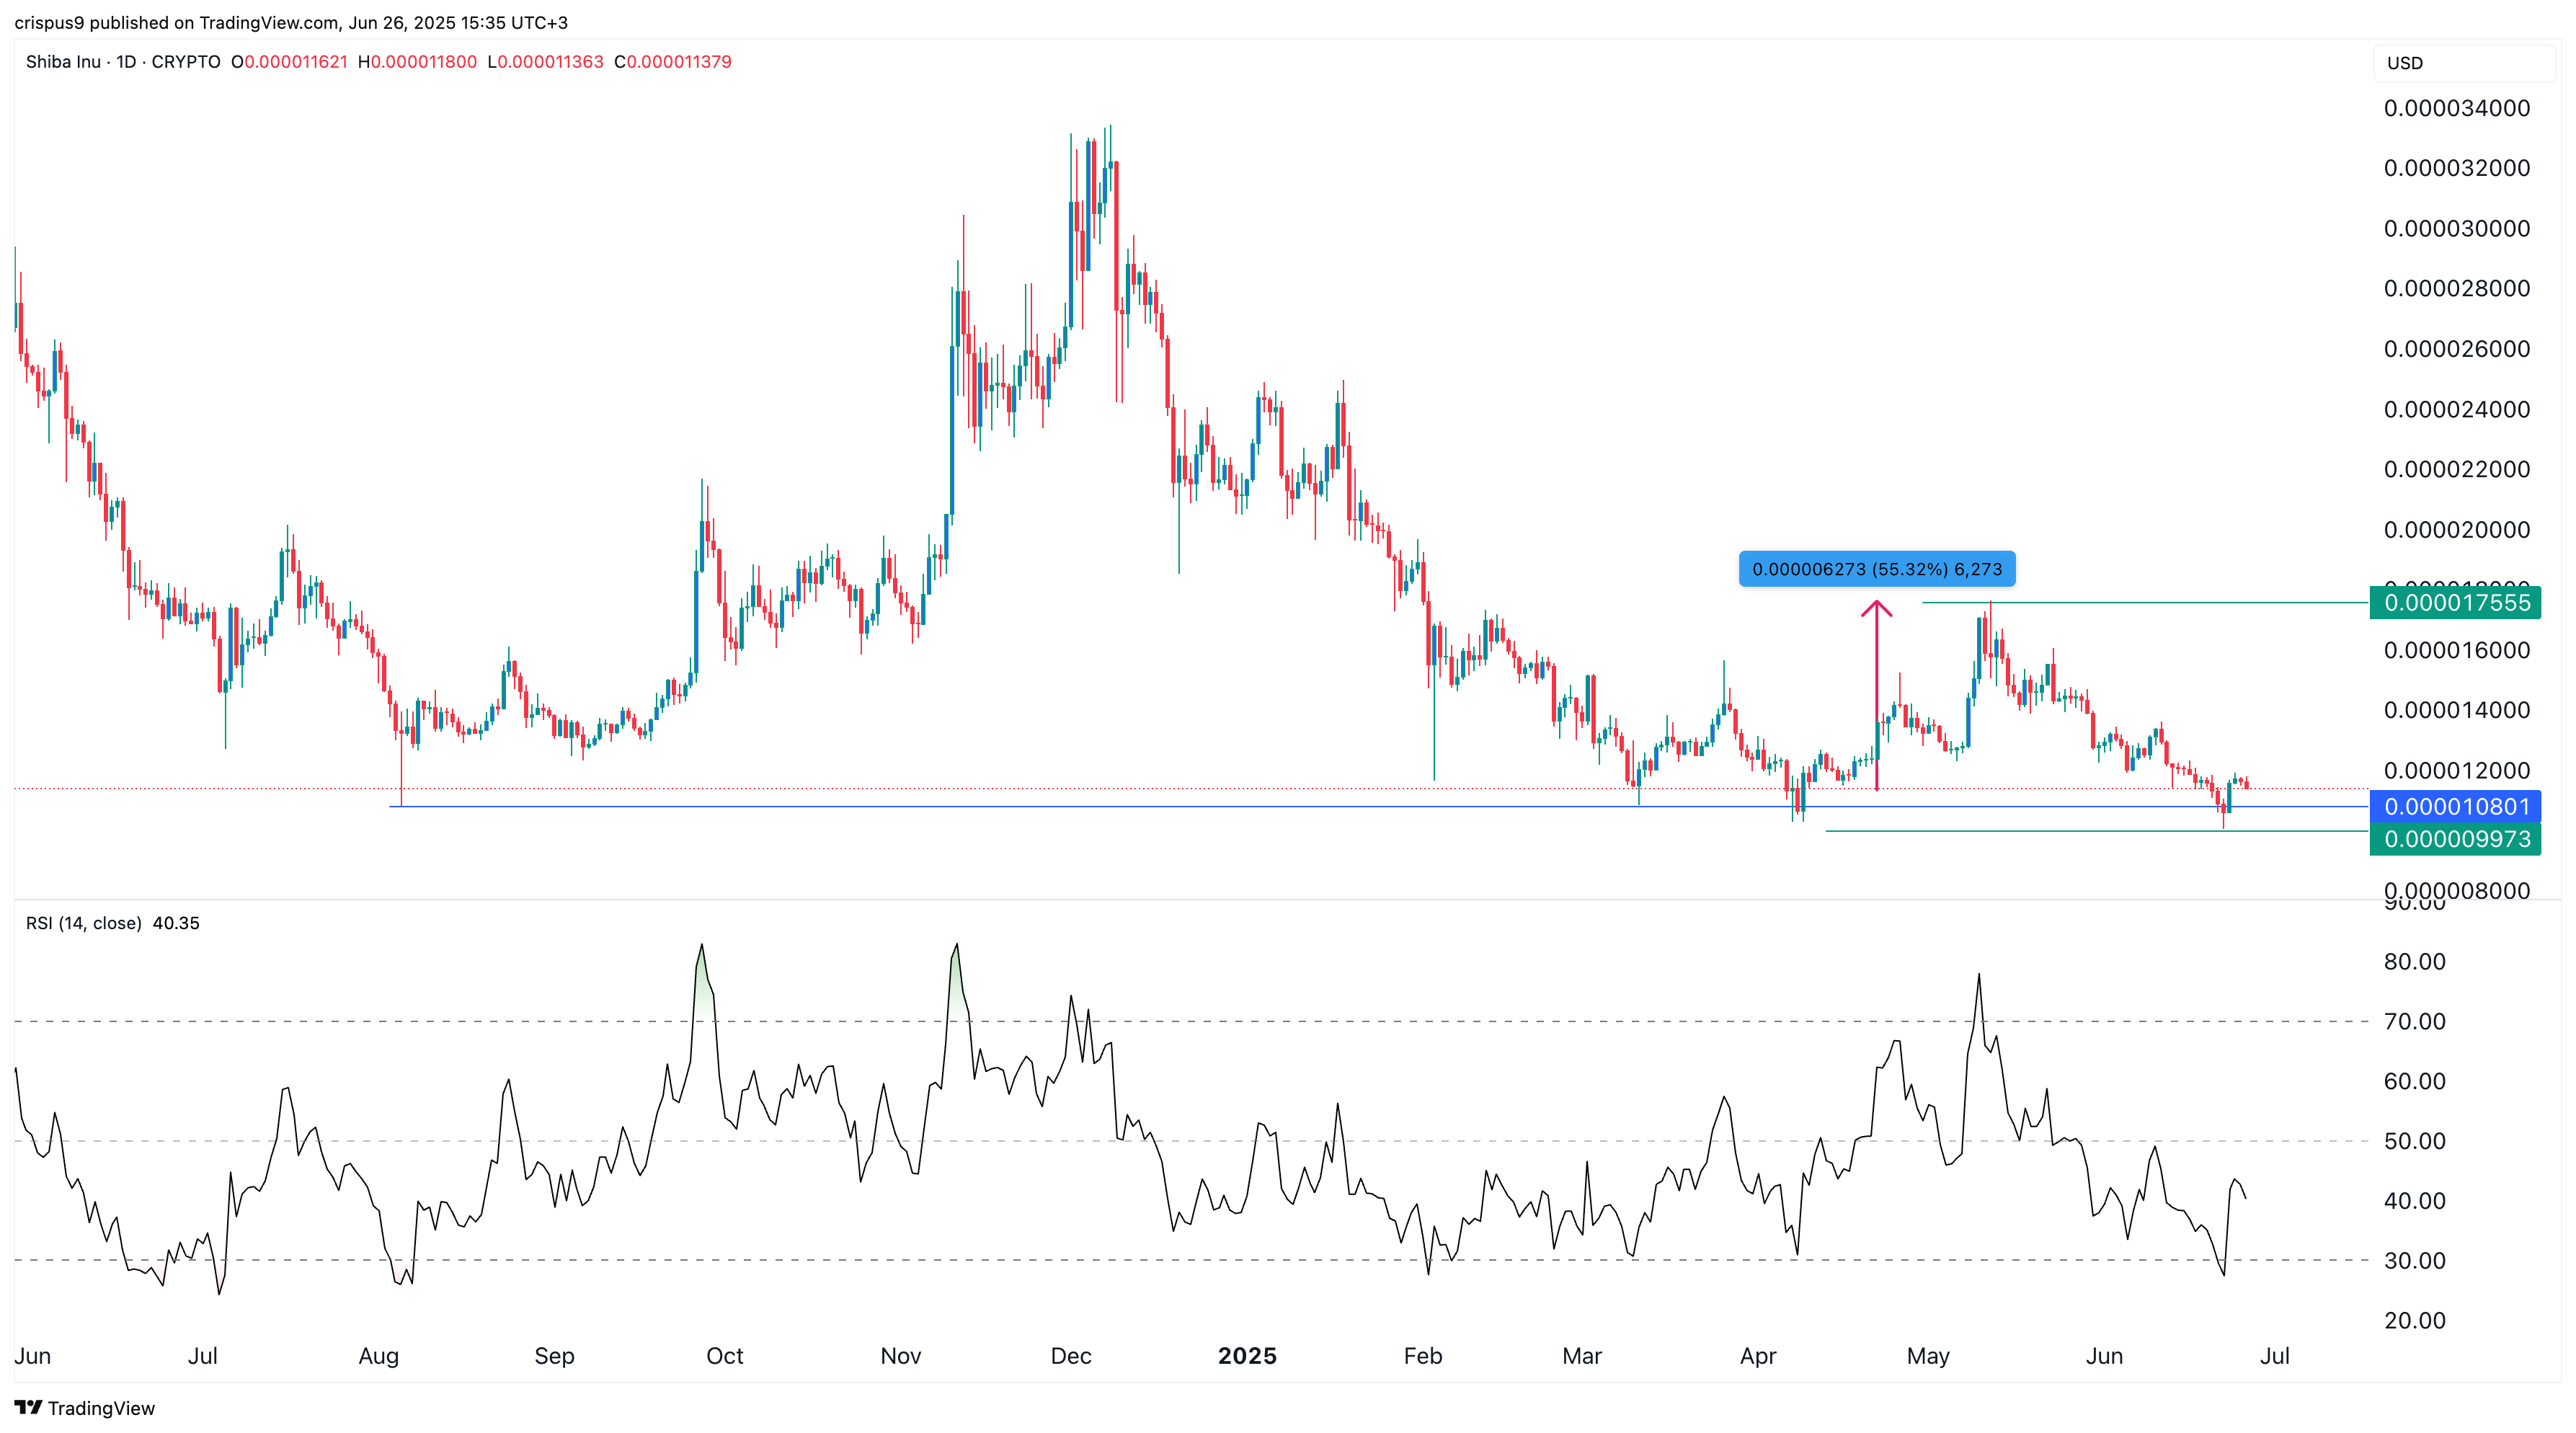
The daily chart shows that the SHIB price bottomed at $0.00000997 on Monday and then bounced back to $0.00001135. Its lowest point this week was the lowest swing in April this year and August 2024.
It has formed a double-bottom pattern whose neckline is at $0.00001755. A double bottom is a highly bullish sign in technical analysis. The Relative Strength Index has also moved from the oversold level of 28 to 40.
The token is likely to bounce back and possibly hit the neckline at $0.00001755, representing a 55% increase from the current level. However, a drop below the key support level of $0.0000099 would invalidate the bullish outlook and suggest further downside risk.


