

The Iran and Israel war came to a halt as the USA intervened. Owing to this, safe haven assets like gold and silver saw a decline in prices.
The bias in gold has now changed to sell; however, a retracement can be expected this week to major key levels from where traders can look to enter further sell positions. Let’s discuss the key pivot levels for gold buying and selling in this weekly forecast from June 30th to July 4th, 2025.
Key economic events of this week
Some significant U.S. economic reports are scheduled for release this week that are expected to impact XAUUSD.
Tue, Jul 1 – Fed Chair Powell Speaks, ISM Manufacturing PMI, JOLTS Job Openings
- Powell’s speech might increase volatility because hawkishness could hurt gold while dovishness could weaken the USD and increase gold.
- Despite being marginally better than expected, the ISM Manufacturing PMI still indicates contraction, which provides some minor support for gold.
- Gold upside may be constrained by labor market resiliency, as evidenced by stronger-than-expected JOLTS job postings.
Wed, Jul 2 – ADP Non-Farm Employment Change
Labor market strength is indicated by a strong beat in ADP jobs statistics (105K vs. 37K). As rate hike expectations are renewed, this might strengthen the USD and put pressure on gold.
Thu, Jul 3 – Average Hourly Earnings, Non-Farm Employment Change, Unemployment Rate, ISM Services PMI
- Gold is favored by weaker NFP (120K vs. 139K) and slower wage growth (0.3% vs. 0.4%), which indicate cooling labor and inflation.
- Further evidence for this story comes from a higher unemployment rate (4.3% vs. 4.2%).
- Gold may have greater upward momentum as concerns about an economic slowdown increase if the ISM Services PMI likewise exhibits weakness.
Read more: XAUUSD weekly forecast: $3600 next target for gold?
Gold HTF Overview
Today is the last day of June, which means that the monthly close may decide where July can take the price of gold. Here we can see that the price has already swept the high of May 2025, and $3122 low is now pending. A red monthly candle close can take gold to $3122; however, a good bullish close can push it again to test $3441.

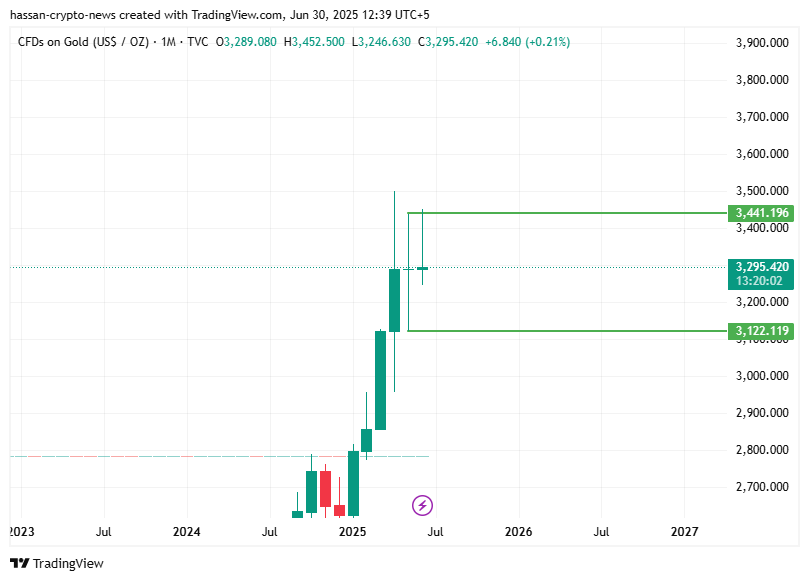
XAUUSD 1m chart – Source: Tradingview
Gold Forecast for June 30th to July 4th, 2025
The best zone to short gold is the $3320-3337 level, due to the POC, breaker block, and the golden fib level on the 3h timeframe.
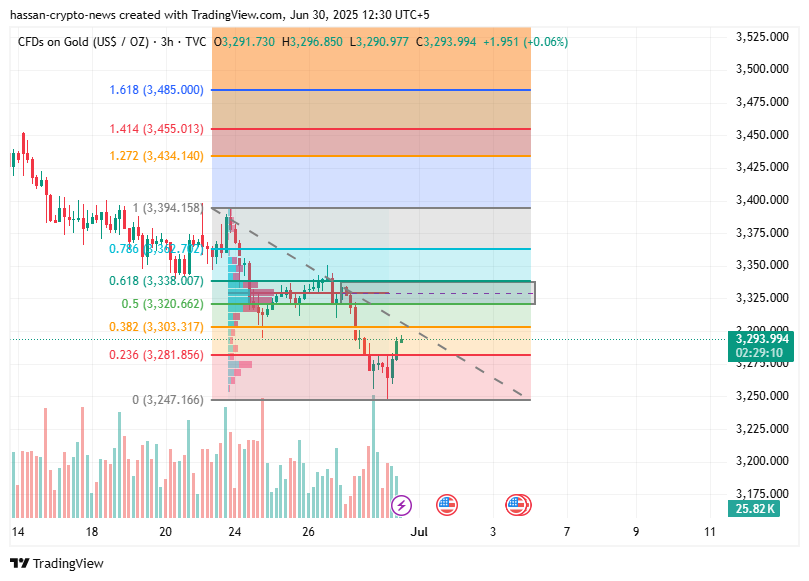
XAUUSD 3h chart – Source: Tradingview
Meanwhile, the closest level in the 30m chart of gold for selling is at $3301-3313. Here we can see how the price has broken its support and now it is acting as resistance.
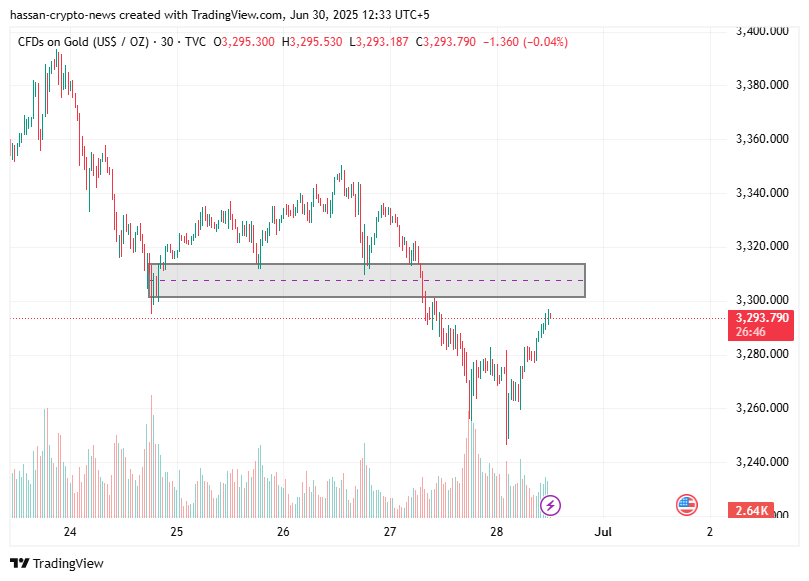
XAUUSD 30m chart – Source: Tradingview
Major buying in gold is now expected from the $3232-$3202 level, which is a 4h order block and FVG in gold.
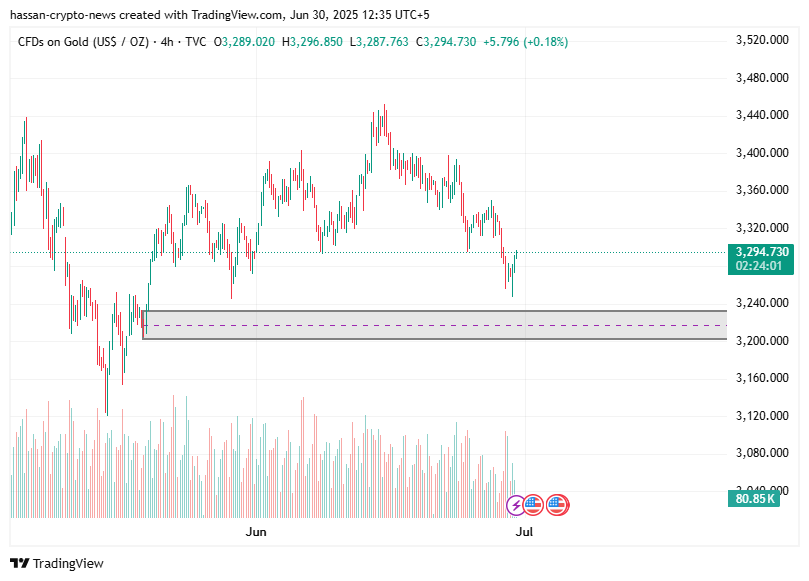
XAUUSD 4h chart – Source: Tradingview
Read more: Goldman Sachs scraps recession forecast as Trump pauses tariffs
Trading Strategies & Investment Recommendation
To conclude, gold can give both buys and sells this week. Lower time frames are suggesting sells, while higher time frames are still favoring a buy position in gold.
Resistance Levels
- $3301-3313 – support turned resistance
- $3320-3337 – POC, breaker block, and golden fib level
Support Levels
- $3232-$3202 – 4h order block and FVG
Disclosure: This article does not represent investment advice. The content and materials featured on this page are for educational purposes only.


