

After Bitcoin’s brief dip below $100k in the 3rd week of June, it rallied up and has almost completed a V-shape recovery. This has also triggered a rally in major altcoins across the board.
In this article, we’ll discuss what’s next for Bitcoin (BTC) in July 2025 and also dive into July 2025 crypto price predictions for some of the top altcoins that are traded in the cryptocurrency space.
Bitcoin price prediction
BTC had an eventful past few weeks as it endured the geopolitical tensions of the world, and despite dipping sharply below $100k last month, it is now trading comfortably over $118k.
As of July 22, 2025, Bitcoin is trading near $118,400, after reclaiming and testing the 50‑day EMA (~$108,700). The short‑term setup appears weak, with momentum indicators failing to sustain bullish conviction. Expect continued sideways play between $116,500 and $119,000 as volume cools. A clear breakout above $119,000–$120,000 could signal a move toward $122k–$124k, while a break below $116,000 raises the risk of a deeper pullback toward $114,800–$112,000.
It should be noted that the price action of BTC will dictate how major altcoins or the cryptocurrency market in general will behave in the month of July 2025. A good approach would be to buy altcoins at BTC support and sell them when BTC reaches its resistance levels.


Ethereum price prediction
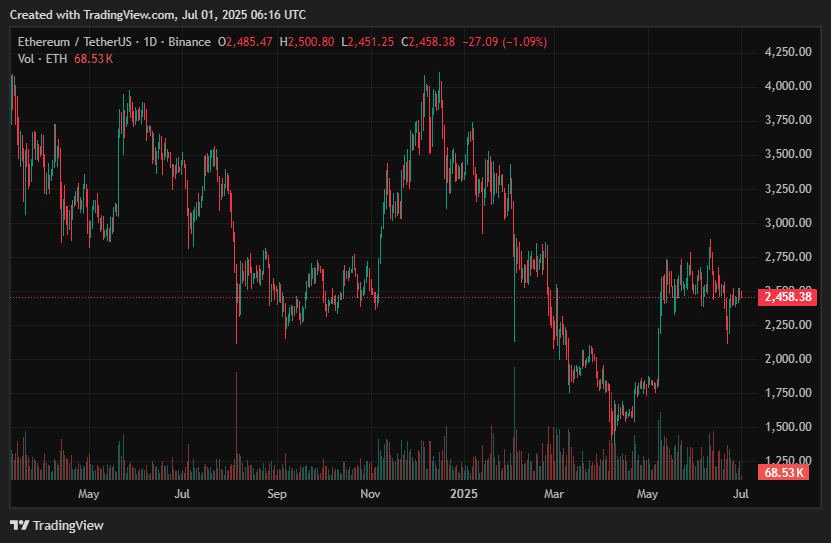
Ethereum has clearly reclaimed its 200‑day EMA (~$2,880) and formed a bullish symmetrical triangle over the past month. It’s now snug below multi‑month supply in the $3,800–$4,100 zone, with momentum still intact and healthy support at $3,610–$3,550.
Institutional interest is surging—ETF inflows are record-breaking, and whales continue holding above $2,520. A breakout past $3,800–$3,850 could trigger a sharp rally to $4,100–$4,500, while a pullback to $3,550–$3,610 would likely be a buying opportunity. However, a break below $3,525 risks a deeper correction toward $3,100.

XRP price prediction
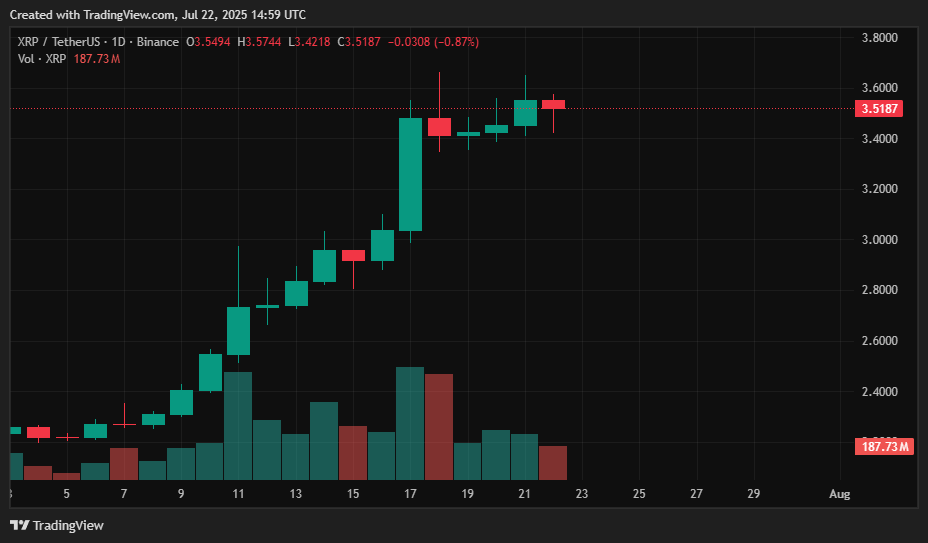
Ripple (XRP) has broken decisively above a multi-year symmetrical triangle pattern, riding July’s 56% rally to currently trade near $3.67, with support at $3.55–$3.60 and resistance forming at $3.84–$4.00. The breakout comes on the back of strong institutional interest, including Ripple’s application for a U.S. banking license and record inflows into crypto funds following the signing of the GENIUS Act.
Momentum indicators like RSI remain neutral, suggesting room for further movement depending on macro market cues. With Bitcoin currently holding strong above $118,000, XRP’s breakout setup remains intact, and a measured move toward $6.00 stays on the table.
Given BTC’s strength, XRP is likely to continue trading within a bullish range between $3.55 and $4.00, with upside targets toward $4.50–$6.00 if resistance at $3.84 is cleared. A minor pullback to $3.30–$3.55 would be viewed as a retest of former triangle resistance. Broader market sentiment is further supported by regulatory clarity and Ripple’s deepening links with traditional finance. Still, the upcoming SEC appeal decision on July 24 may introduce short-term volatility in what is otherwise a structurally bullish trend.
Solana price prediction
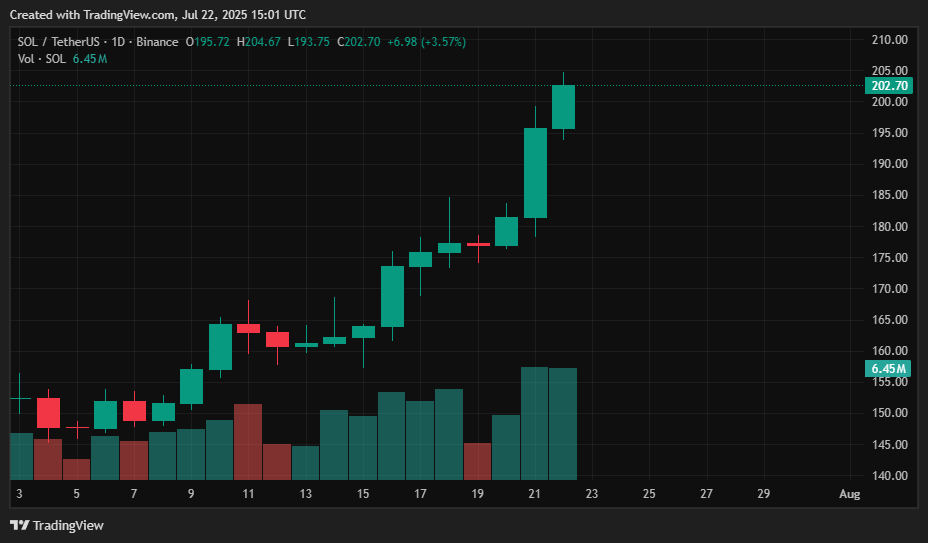
Solana’s revival in 2025 remains strong, fueled by a revitalized DeFi and NFT ecosystem and significant institutional interest. SOL reclaimed the crucial $200 level and is now trading near $200.56, comfortably within its upward channel. Daily DEX volumes have surged—reaching $1.4 trillion in July on platforms like Raydium—while staking ETFs (e.g., Rex‑Osprey) have drawn meaningful inflows ($42 M+), supporting tokenomics and validator participation.
The technical picture shows SOL targeting the $165–$170 zone after reestablishing $150 support, and a breakout above $170 could propel the next resistance to $185, the pre‑March high.
With Bitcoin trading around $118,800, well above key thresholds, Solana is positioned to continue its bullish trajectory. SOL is likely to push toward $170–$185 in this favorable BTC environment; a dip in Bitcoin could pull SOL back to the $140–$145 support range, presenting attractive buying opportunities.
The confluence of network strength, institutional capital, and ETF enthusiasm suggests robust upside, though macro volatility and technical pullbacks remain possible.
Dogecoin price prediction
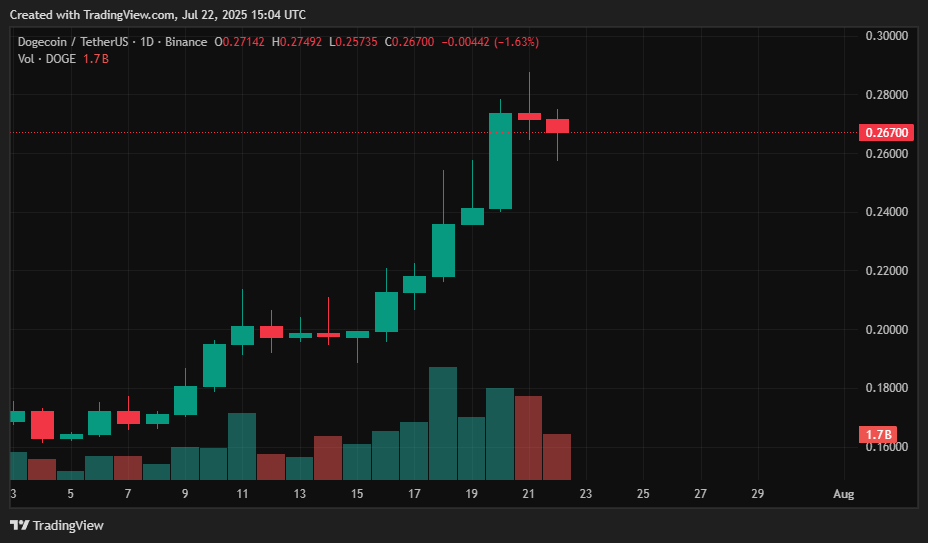
Dogecoin (DOGE) has quietly appreciated amid broader market optimism and buzz about integration with X (formerly Twitter). It’s currently stabilizing around $0.26–$0.27—well above the regained support at $0.15–$0.17—with strong whale accumulation fueling momentum . Technically, Dogecoin exhibits signs of bullish divergence on the MACD and remains above its 50-day EMA, setting the stage for a potential breakout. A move above $0.30—aligned with analyst forecasts—is likely to trigger FOMO, possibly sending DOGE toward $0.32–$0.45 in the short term .
With Bitcoin trading near $117–119k, the macro environment is favorable for altcoin rallies . In this backdrop, DOGE may easily reach the $0.30–$0.35 zone, and potentially up to $0.45 if a meme-coin wave materializes. However, if BTC falters—dropping to the $110k range—expect DOGE to retreat toward $0.20–$0.22, with deeper pullbacks around $0.20 offering opportunistic entry points. Volatility should remain elevated, so position sizing and risk management are key.
Hyperliquid price prediction
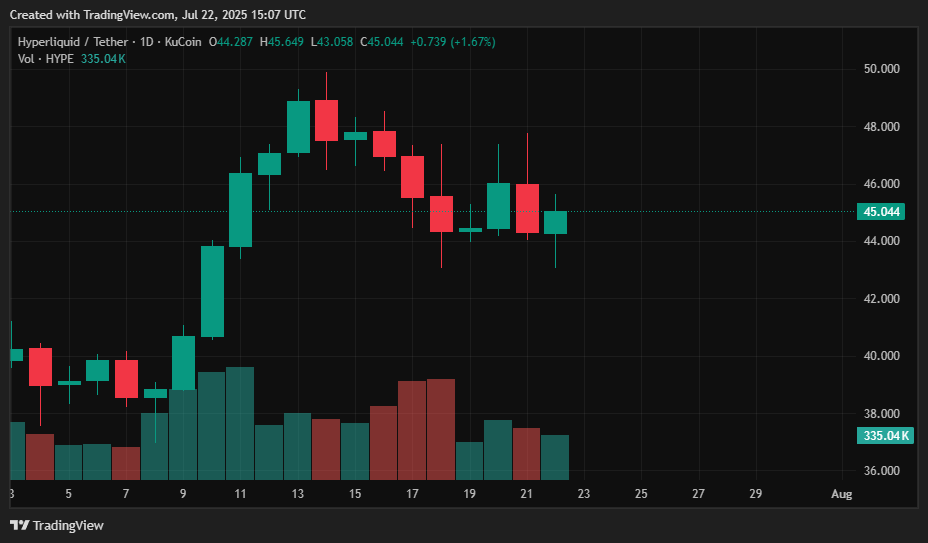
Hyperliquid (HYPE), is currently trading around $44–$45, following a peak in June near $47–$48. It’s consolidating within a bullish pennant pattern amid strong surge in trading volume (up ~20%) driven by persistent Binance.US listing rumors and renewed whale accumulation. On the daily chart, HYPE remains well above its 50‑day SMA (~$40), and the pennant formation—coupled with bullish indicators—suggests readiness for a breakout. A move above $46–$47 could propel HYPE toward fresh all‑time highs around $50–$57, with key resistance zones lining up at $45–$48.
With Bitcoin hovering around $118,800, the favorable macro backdrop enhances Hyperliquid’s breakout potential. If bullish momentum holds, HYPE could challenge the $50–$57 range in short order. However, a BTC pullback might drag HYPE down to $35–$38, which dovetails with technical support from the pennant base and Fibonacci levels—offering a strategic entry zone. Investors should keep an eye on BTC for directional clues, while also tracking any official Binance spot listing news, which could act as a strong catalyst.
Sui price prediction
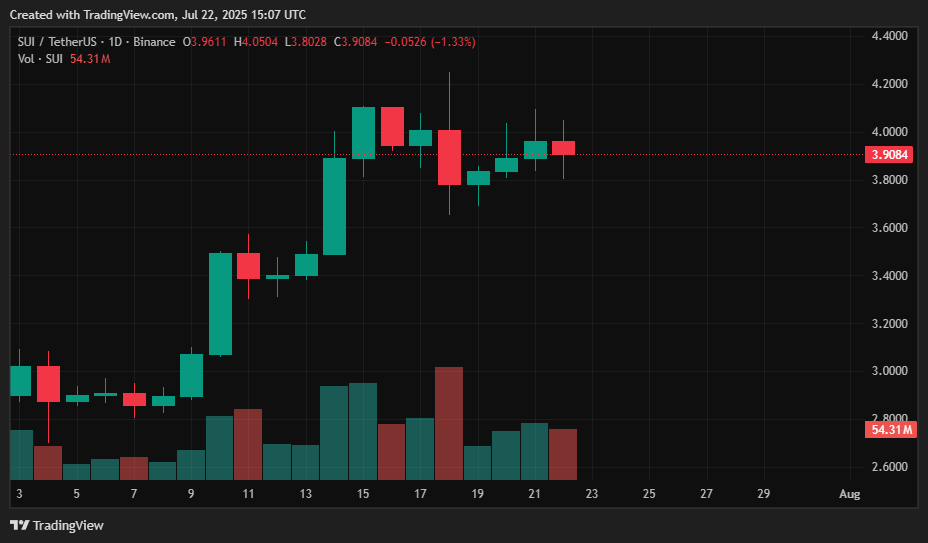
SUI is currently consolidating in a tight range between $3.82 and $3.92, having rebounded from crucial support above $3.80 after July’s sharp rally. The Bollinger Bands are narrowing—an early sign of a potential breakout—as %B sits around 0.76, placing SUI near the upper band of its recent range ($4.23).
Momentum indicators remain bullish: the RSI (~62), MACD, and histogram all support upside momentum without being overbought, indicating there’s room for growth. Daily support lies at $3.80–$3.85, while resistance clusters around $4.05–$4.10, just above the upper Bollinger band.
Chainlink price prediction
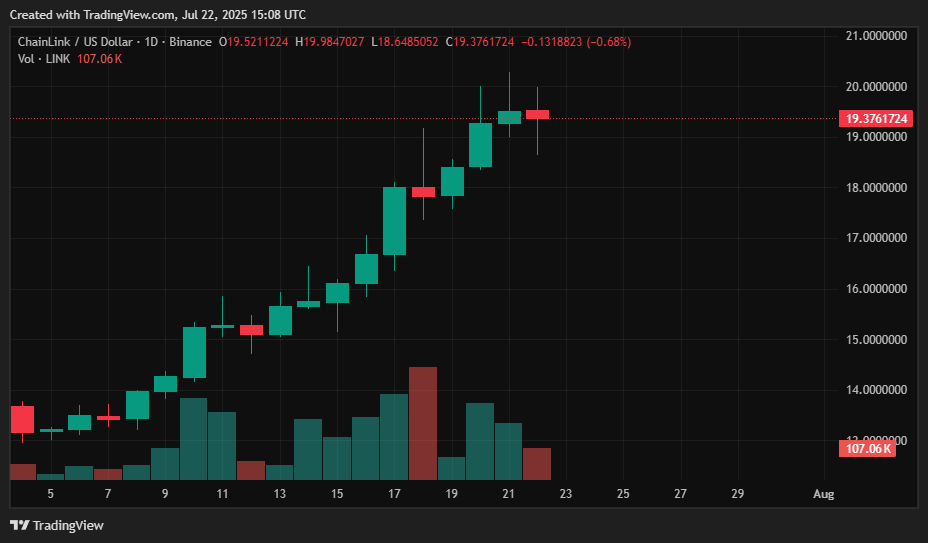
Chainlink’s (LINK) oracle network has seen growing traction in both DeFi and TradFi, with European banks integrating its CCIP for FX settlements and new partnerships unlocking access to tokenised real-world assets—strengthening its use case in regulated finance. On the daily chart, LINK is forming a bullish flag near $19.40, having recently reclaimed support around $17.50–$18.00. Trading volumes have surged (~70% in the past week), fueling optimism.With the upcoming CCIP v2 upgrade and its expanded bank collaborations, a breakout above $20–$21 could drive LINK toward the $22–$23 range, with upside potential to $25–$28 if momentum sustains.
With Bitcoin holding above $119k, the macro environment is bullish for altcoin rallies. In this setup, expect LINK to reach the $22–$25 zone if it clears the flag pattern cleanly. A safer accumulation zone lies in the $18.00–$19.00 range following a potential retest of the flag base. Broader factors—such as growing on-chain outflows (indicating accumulation) and Chainlink’s expanding institutional integrations—further support the bullish thesis.
Avax price prediction
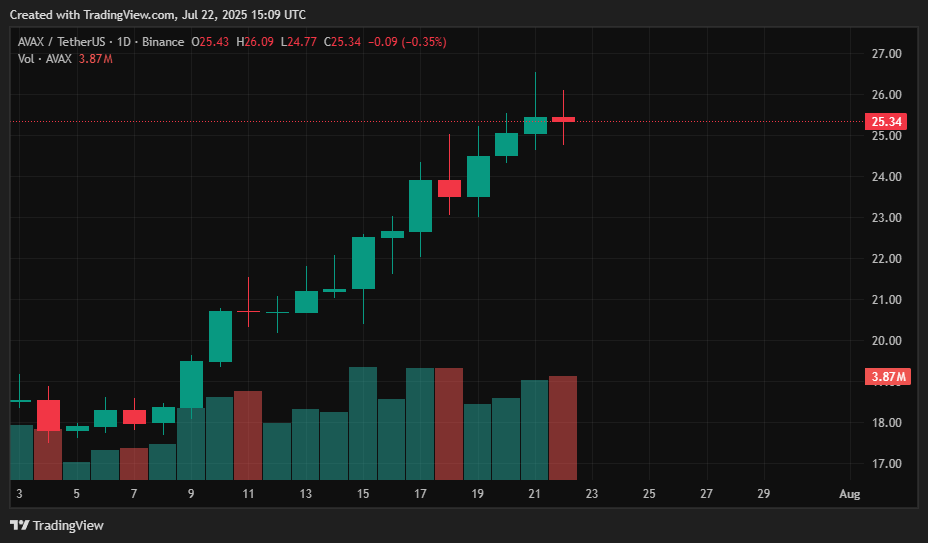
Avalanche (AVAX) is currently trading around $25.39, firmly above the $17.50–$18 resistance zone mentioned, following a recovery from mid-June lows of around $15.50). On-chain indicators are turning bullish—daily transactions recently hit ~20 million and address activity has surged, reflecting increasing institutional staking and subnet usage.
Chart-wise, AVAX has completed a double-bottom with the neckline near $18.20, and a breakout above that level has already propelled price toward its next resistance zone (~$25–$26). As it stands, AVAX is now probing a higher resistance zone around $26–$27, aligning with Fibonacci and structural targets.
With Bitcoin’s strong trading activity and price action, the broader altcoin market is in a bullish phase. If AVAX continues upward, it could target $30–$32, with a more aggressive aim of $35–$40 fueled by strong on-chain activity and growing enterprise adoption. However, should AVAX pull back, the likely demand zones lie between $22–$23—confirmed former resistance turned support—and $20–$21, offering relatively safer entry points aligned with its upward channel.
Disclosure: This article does not represent investment advice. The content and materials featured on this page are for educational purposes only.


