


Algorand price may be approaching a trend reversal, with potential to rally toward $1 if it breaks above the 20-week MA on the weekly chart.
Summary
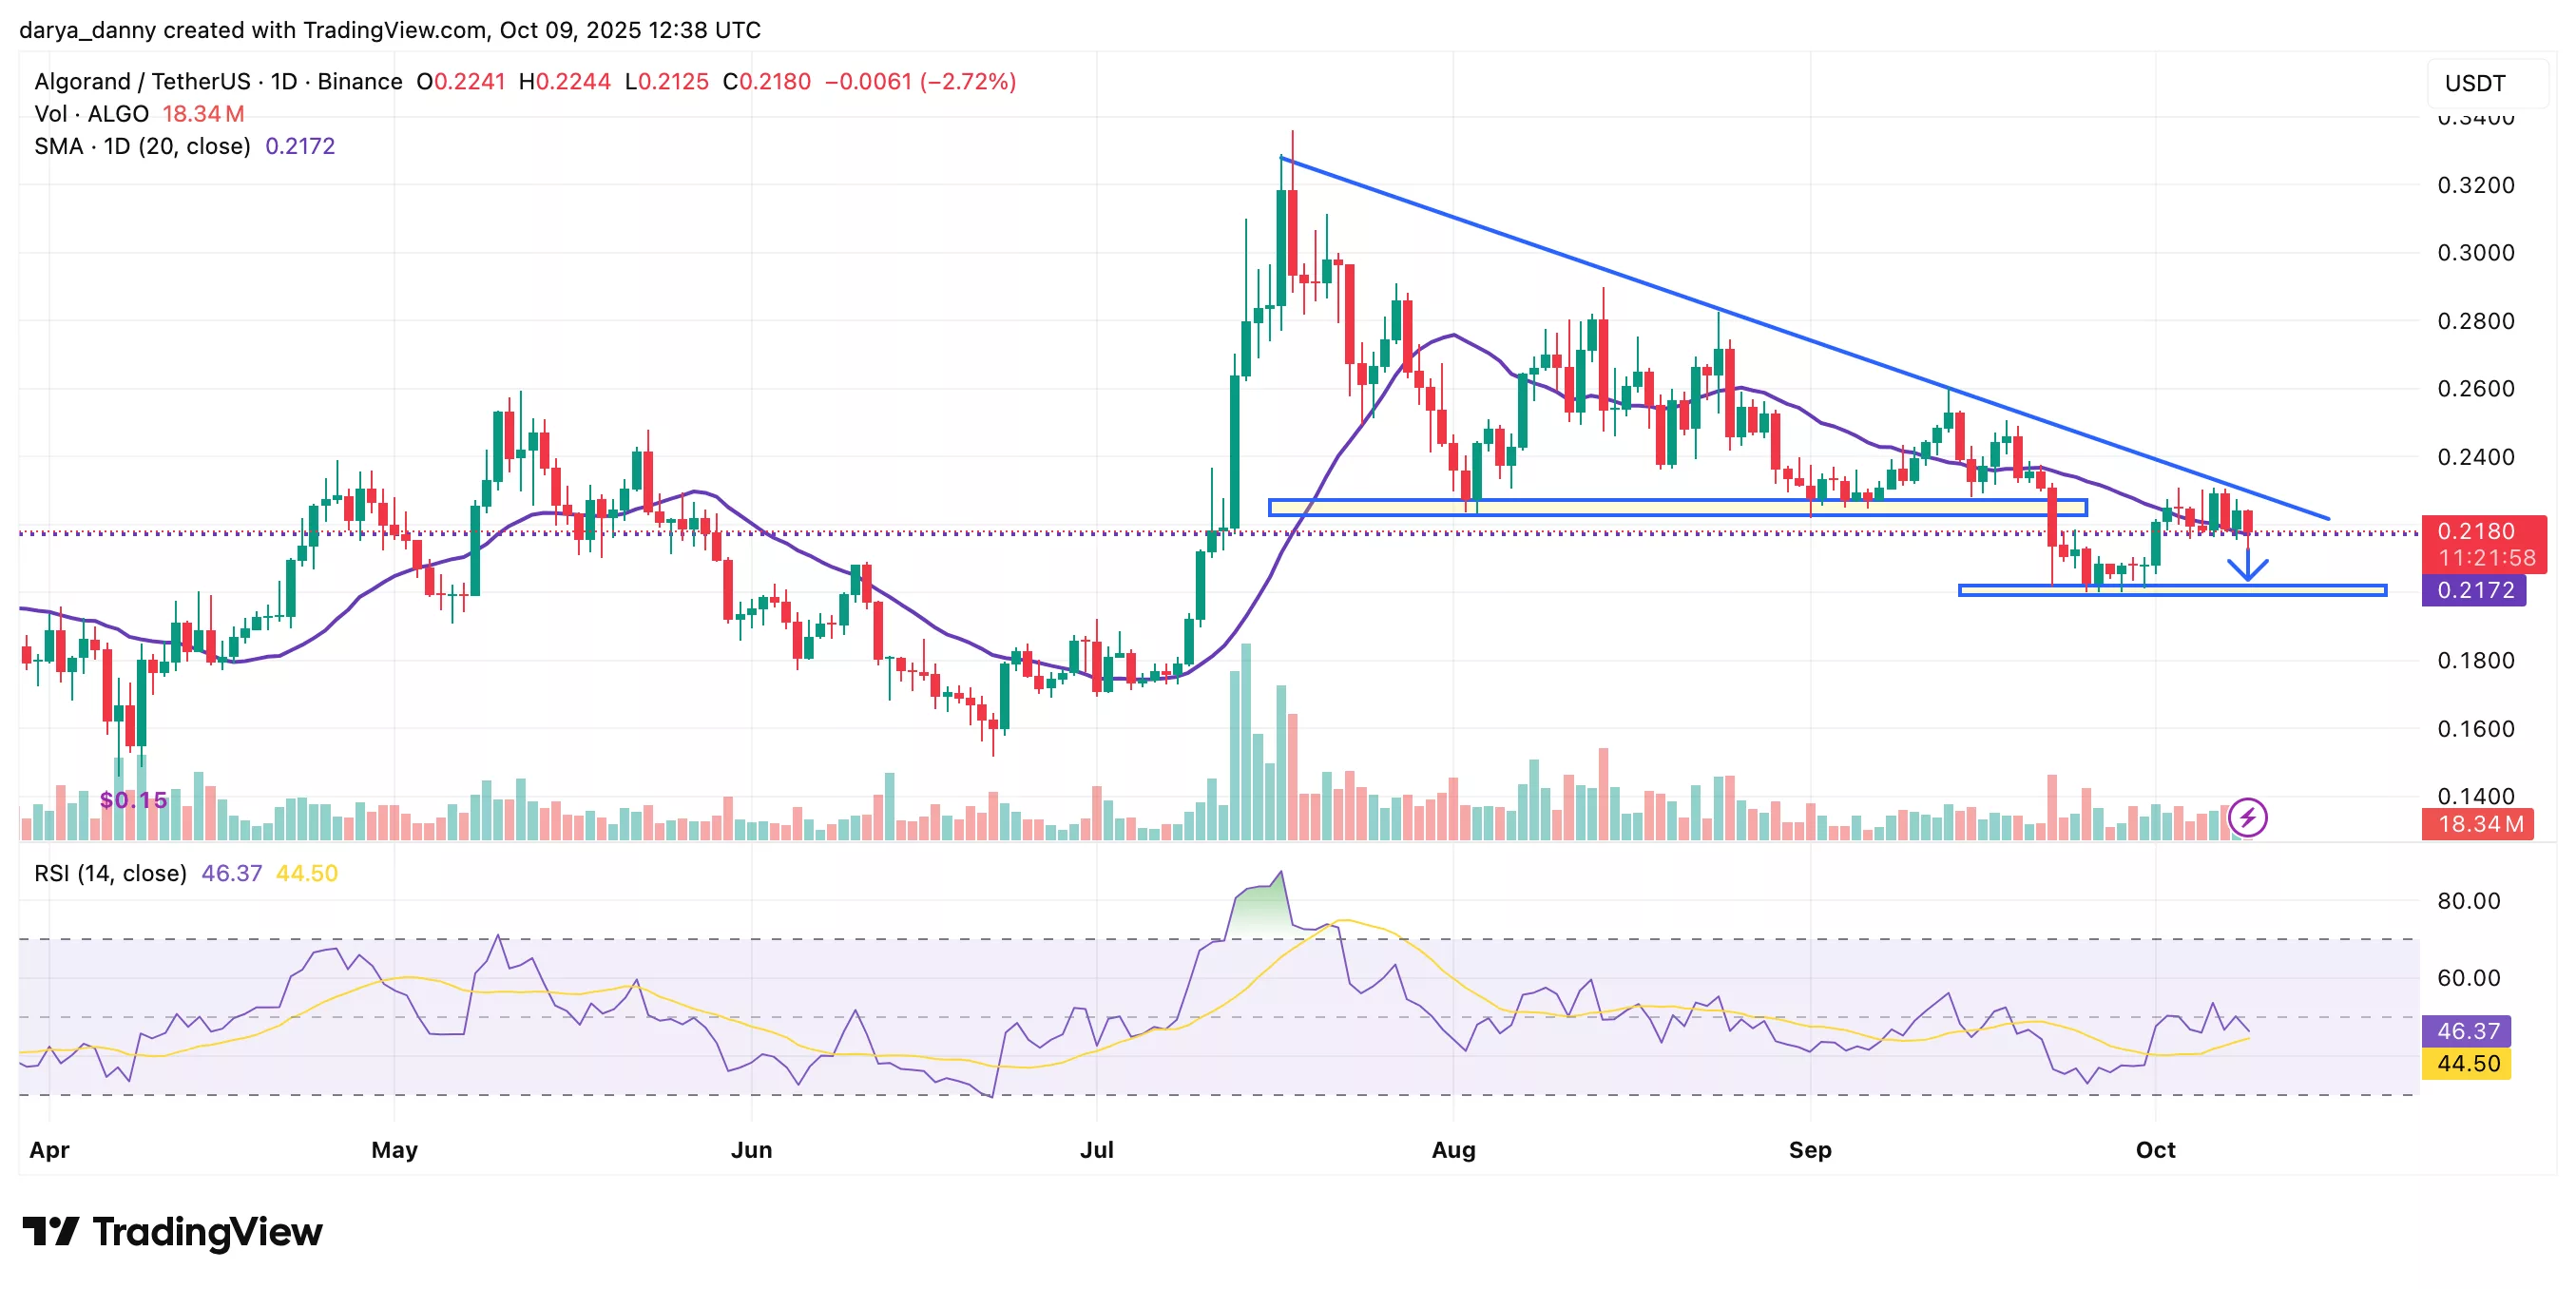
- Algorand price remains in a downtrend, recently dipping below key support at $0.22 before bouncing back.
- A potential double-bottom could form at $0.20, with a breakout above $0.23 possibly driving a move toward $0.26–$0.27.
- Analyst Michaël van de Poppe says that a weekly chart breakout above the 20-week MA could trigger a broader rally toward $0.90–$1.00.
Algorand (ALGO) price continues to extend its downtrend, consistently forming lower highs. The price has recently broken horizontal support around $0.22, dipping to $0.20 where buyers stepped in to scoop the dip, driving the altcoin‘s price back up to retest the $0.22 zone.
However, RSI readings hover around 46, underscoring a neutral-to-bearish bias that leaves room for further downside. Another potential retest of the $0.20 level appears likely, as that area now serves as the new local support.
If this support zone is tested again, it could set up a potential double-bottom pattern, with the neckline forming around $0.23. A confirmed breakout above this neckline could trigger a measured move toward $0.26–$0.27, potentially signaling the start of a trend reversal to the upside.

Michaël van de Poppe: Algorand price could rally to $1
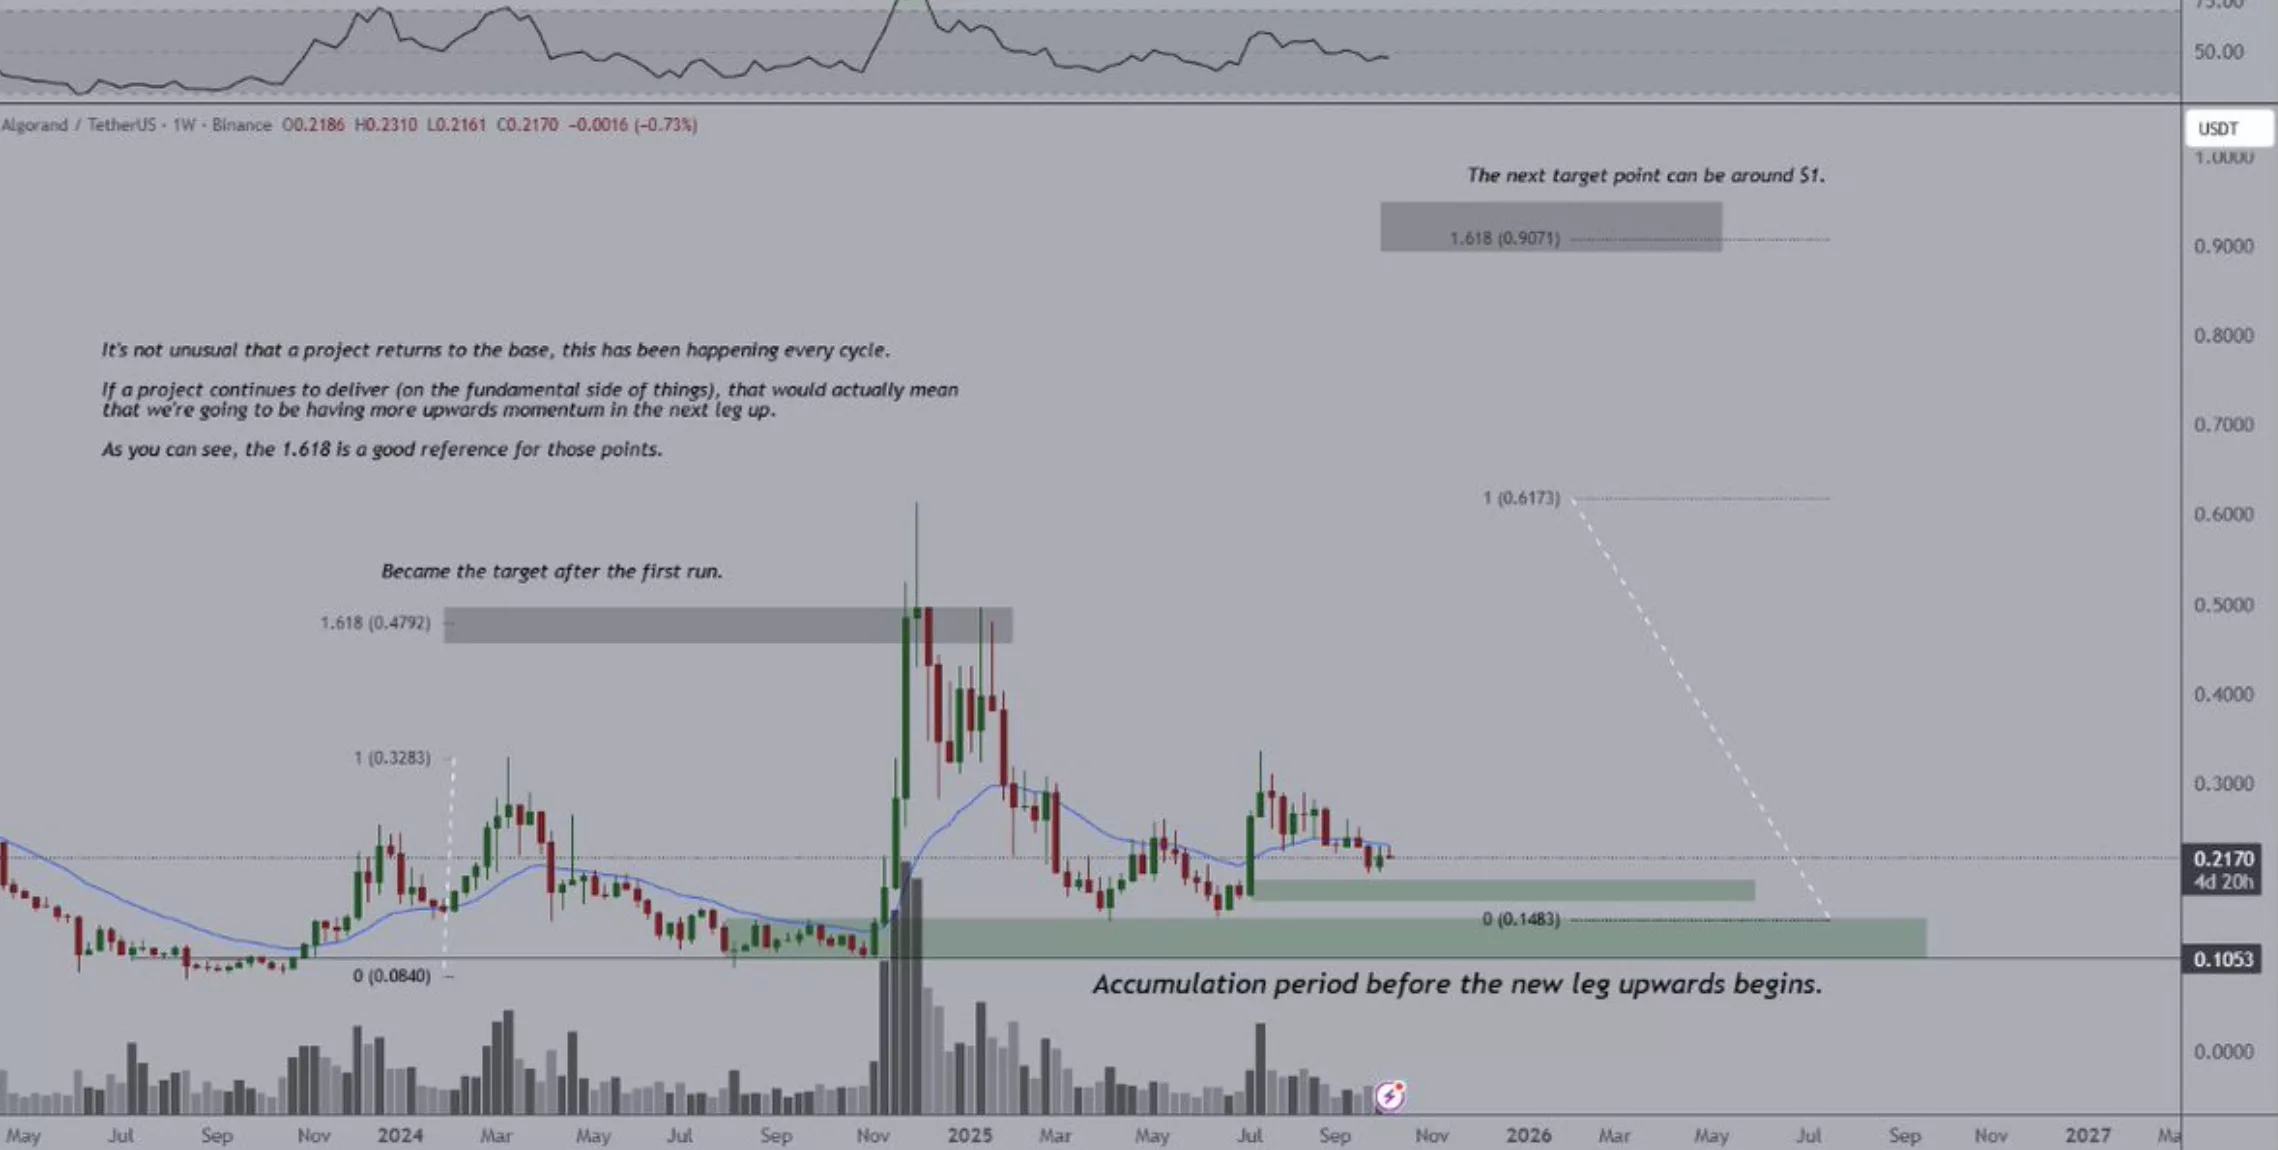
Zooming out to the weekly chart, Algorand price appears to be sliding toward its historical accumulation base, according to analyst Michaël van de Poppe. “It’s not unusual for a project to revisit its base — this tends to happen every cycle,” he wrote in a recent post on X.
van de Poppe suggests that a breakout above the 20-week moving average could signal a broader trend reversal for ALGO and potentially trigger a rally toward the $1 mark, in line with the 1.618 Fibonacci extension level near $0.90–$1.00.


