

Bitcoin price slipped toward $63,300 on Aug. 13 as an in-line U.S. inflation report failed to generate enough demand for a break above the $64,500–$65,000 resistance zone.
Summary
- Bitcoin price fell about 1.5% from $64,300 to $63,300 after the July CPI release.
- The daily chart keeps BTC below the key $66,460 Fibonacci resistance.
- Liquidation clusters sit near $64,000–$64,800 and $62,800, raising the risk of volatility.
- Daily RSI has fallen to 46.61, while the MACD shows renewed bearish pressure.
Bitcoin price action today
The U.S. Bureau of Labor Statistics reported that the Consumer Price Index rose 0.1% in July and 3.4% from a year earlier. Both readings matched market forecasts, while annual inflation eased from 3.5% in June.
Bitcoin initially held near $64,000 after the Aug. 12 release but failed to build on the softer annual reading. The price subsequently fell from around $64,300 to an intraday low near $63,300 before recovering slightly.
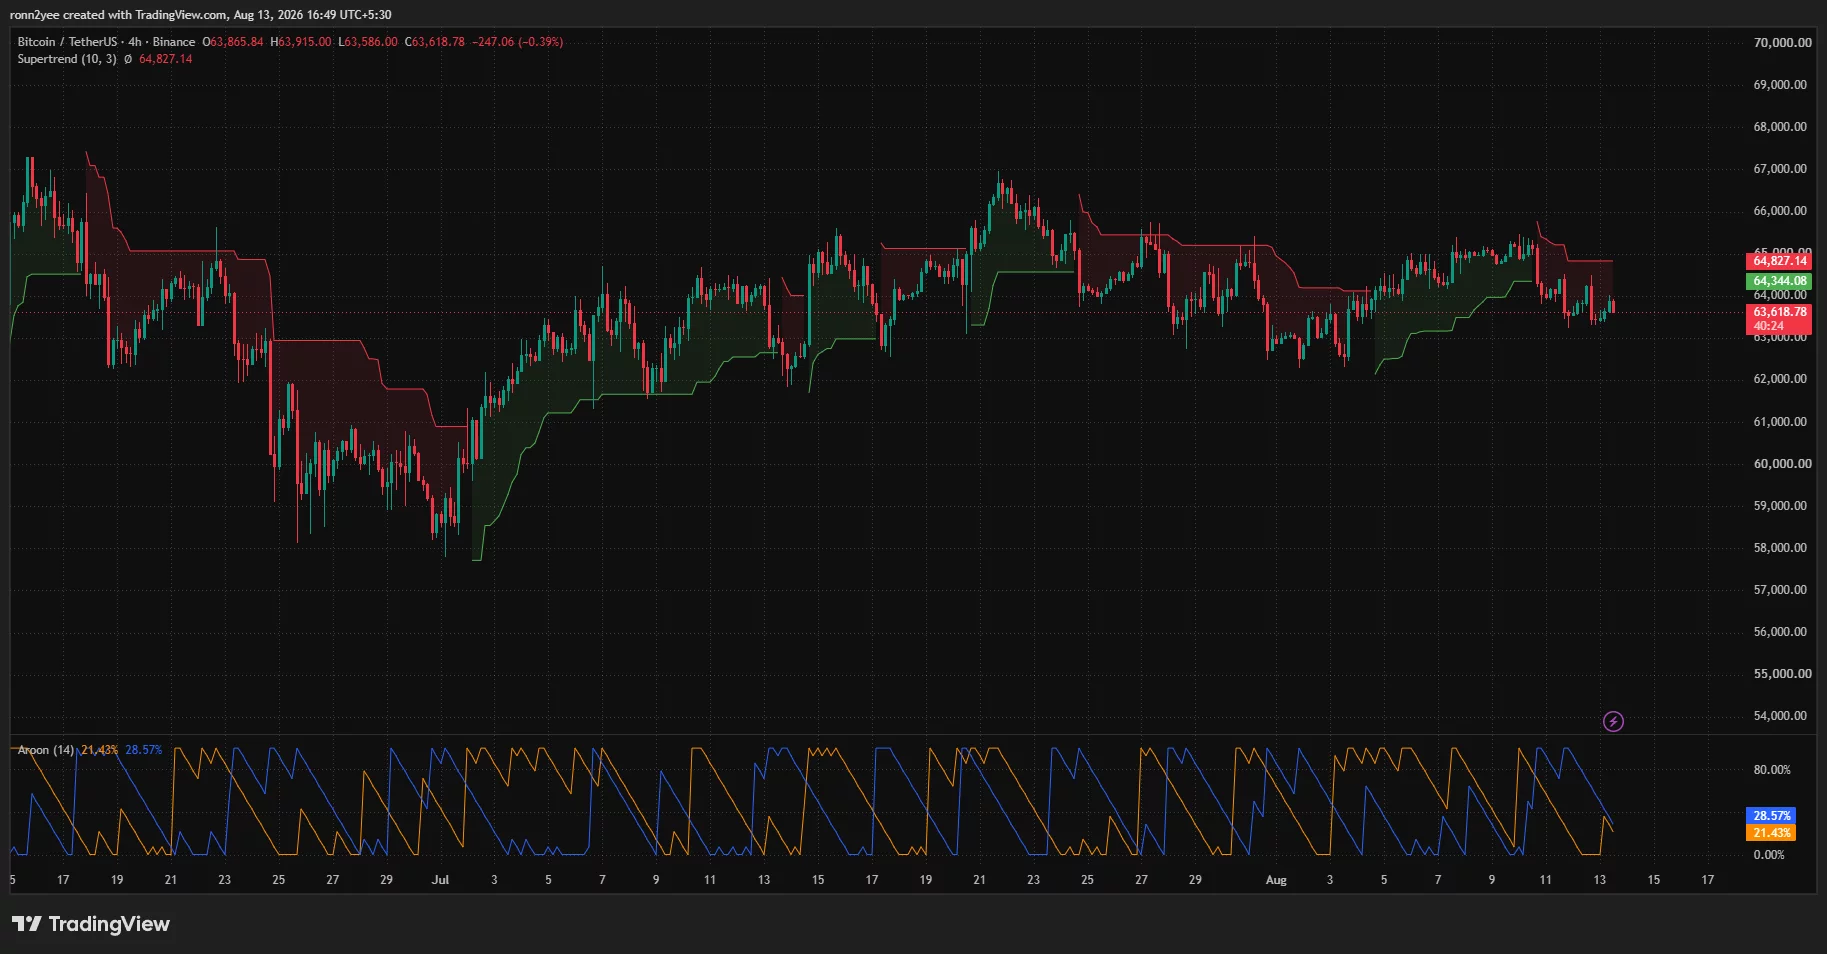
The 4-hour Binance chart showed BTC trading around $63,620 at the time of analysis, down 0.39% during the active candle. Its latest rebound stalled near $63,900, leaving the price below the short-term breakdown area around $64,000.

An in-line CPI report removed the risk of an upside inflation surprise but did not introduce a new reason for traders to increase exposure. Bitcoin’s retreat therefore resembled a sell-the-news move after investors had positioned for a mild inflation reading ahead of the release.
The reaction remained measured rather than disorderly. BTC stayed above its August lows and continued trading inside the broader range that has contained it between roughly $62,000 and $65,000 since late July.
Why the CPI report failed to lift BTC
July’s inflation data offered a mixed backdrop for U.S. investors. Headline CPI cooled on an annual basis, while core CPI rose 0.2% for the month and 2.5% from a year earlier, according to the BLS.
The data reduced the immediate pressure on the Federal Reserve to tighten policy at its September meeting. However, an expected result had largely been reflected in Bitcoin’s price before the release, limiting its ability to attract fresh buyers.
BTC had also struggled repeatedly between $64,500 and $65,000 in recent sessions. Each attempt to hold above that area met selling, preventing the market from confirming a higher high on the 4-hour chart.
Crypto analyst Ted Pillows said Bitcoin was being rejected from the $64,500–$65,000 resistance zone. He identified $62,000–$62,500 as the next important support range if the current pullback extends.
Pillows also attributed part of the weak demand to renewed selling by exchange-traded funds. However, the latest available ETF-flow readings have varied by reporting session, so the broader institutional trend requires confirmation from subsequent U.S. trading-day data.
The next U.S. inflation and labor reports may now carry more weight because they could change expectations for the Fed’s remaining 2026 meetings. Bitcoin has become sensitive to changes in interest-rate expectations as tighter financial conditions reduce demand for risk assets.
Bitcoin technical indicators favor sellers
The daily BTC chart shows the price consolidating below the 0.786 Fibonacci retracement at $66,460. That level is based on the decline from $97,973 to $57,881 and has capped every rebound since Bitcoin briefly approached $67,000 in late July.
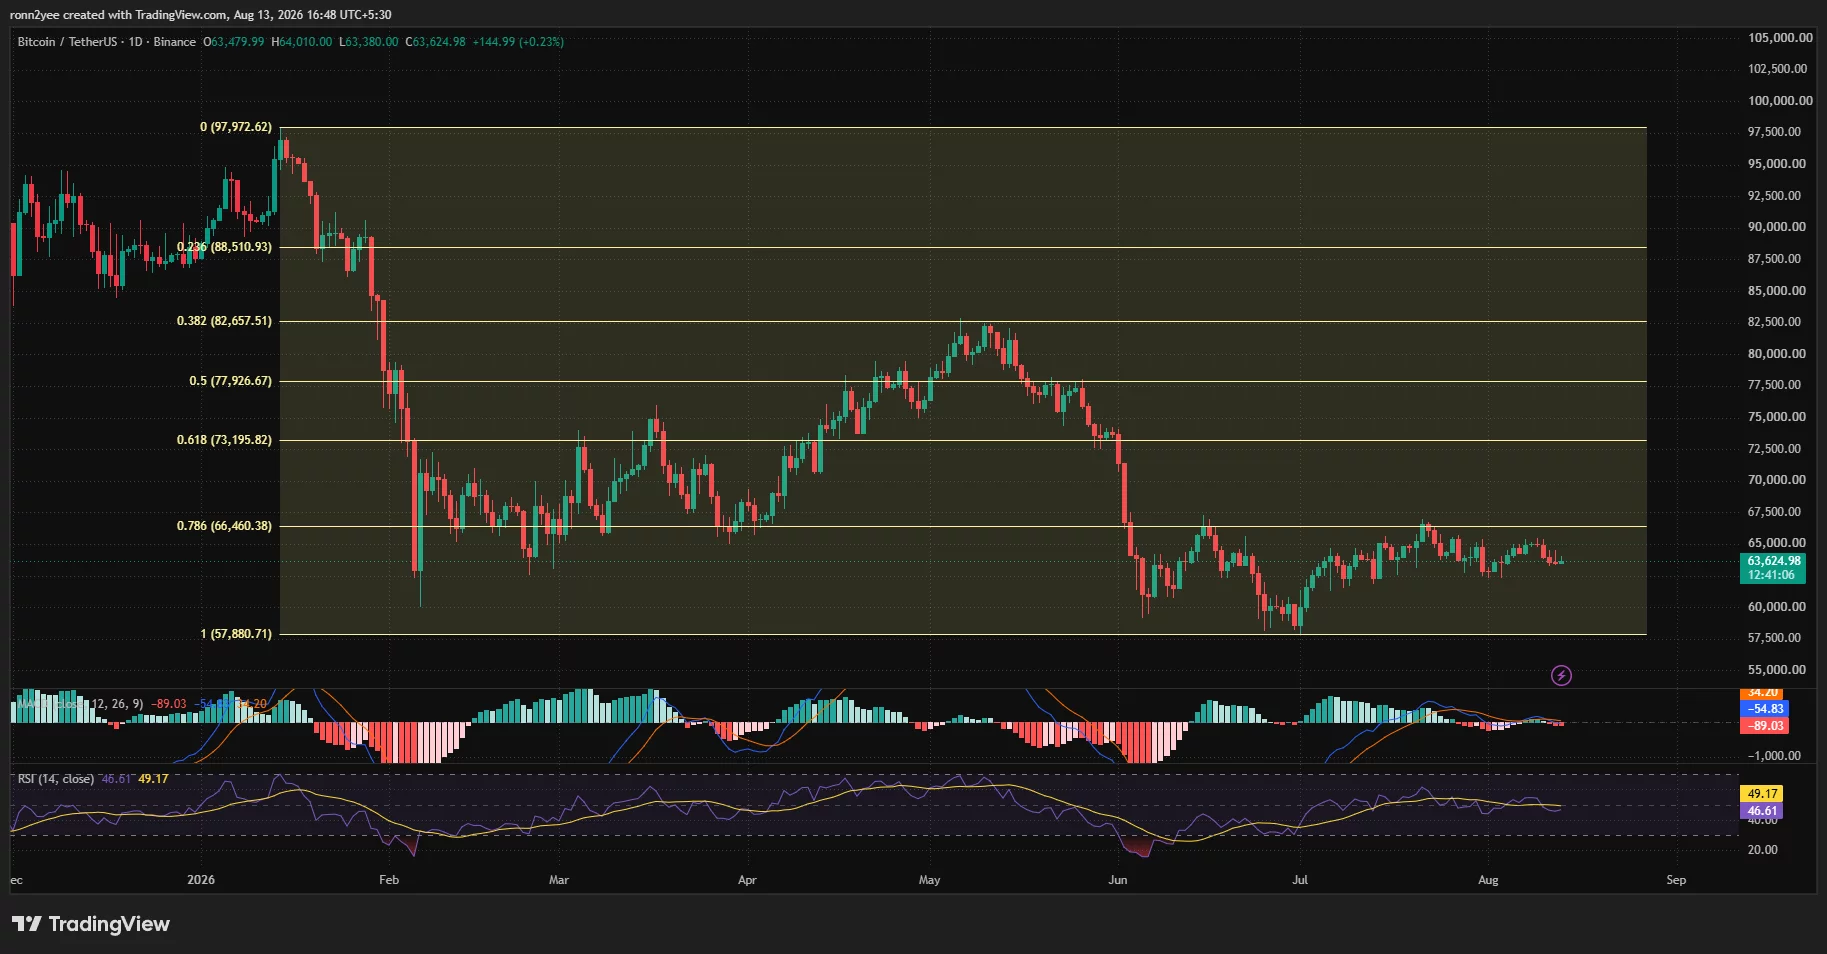
A daily close above $66,460 would weaken the bearish structure and could open a move toward the 0.618 Fibonacci level at $73,196. BTC would first need to reclaim $64,500–$65,000 and sustain the move with stronger trading volume.
Momentum currently favors a more cautious outlook. The daily Relative Strength Index stood at 46.61, below its signal average of 49.17 and the neutral 50 level. The reading shows that sellers have a modest advantage without placing Bitcoin in oversold territory.
The daily MACD line was at approximately minus 54.83, below its signal line near minus 34.20. Its histogram had turned negative, showing that the rebound from the early-July low was losing momentum.
The 4-hour Supertrend also remained bearish, with its resistance line near $64,827. BTC must close above that level to reverse the indicator and strengthen the short-term recovery case.
Aroon readings were less decisive. Aroon Up stood at 28.57%, compared with Aroon Down at 21.43%, suggesting neither side had established a strong 4-hour trend. The low readings fit the range-bound price action seen throughout the past week.
Liquidation levels point to a wider move
CoinGlass’s 24-hour liquidation heatmap showed the largest nearby liquidity concentrations above Bitcoin around $64,050 and $64,700–$64,800. A recovery through $64,000 could draw the price toward those clusters as short positions face liquidation.

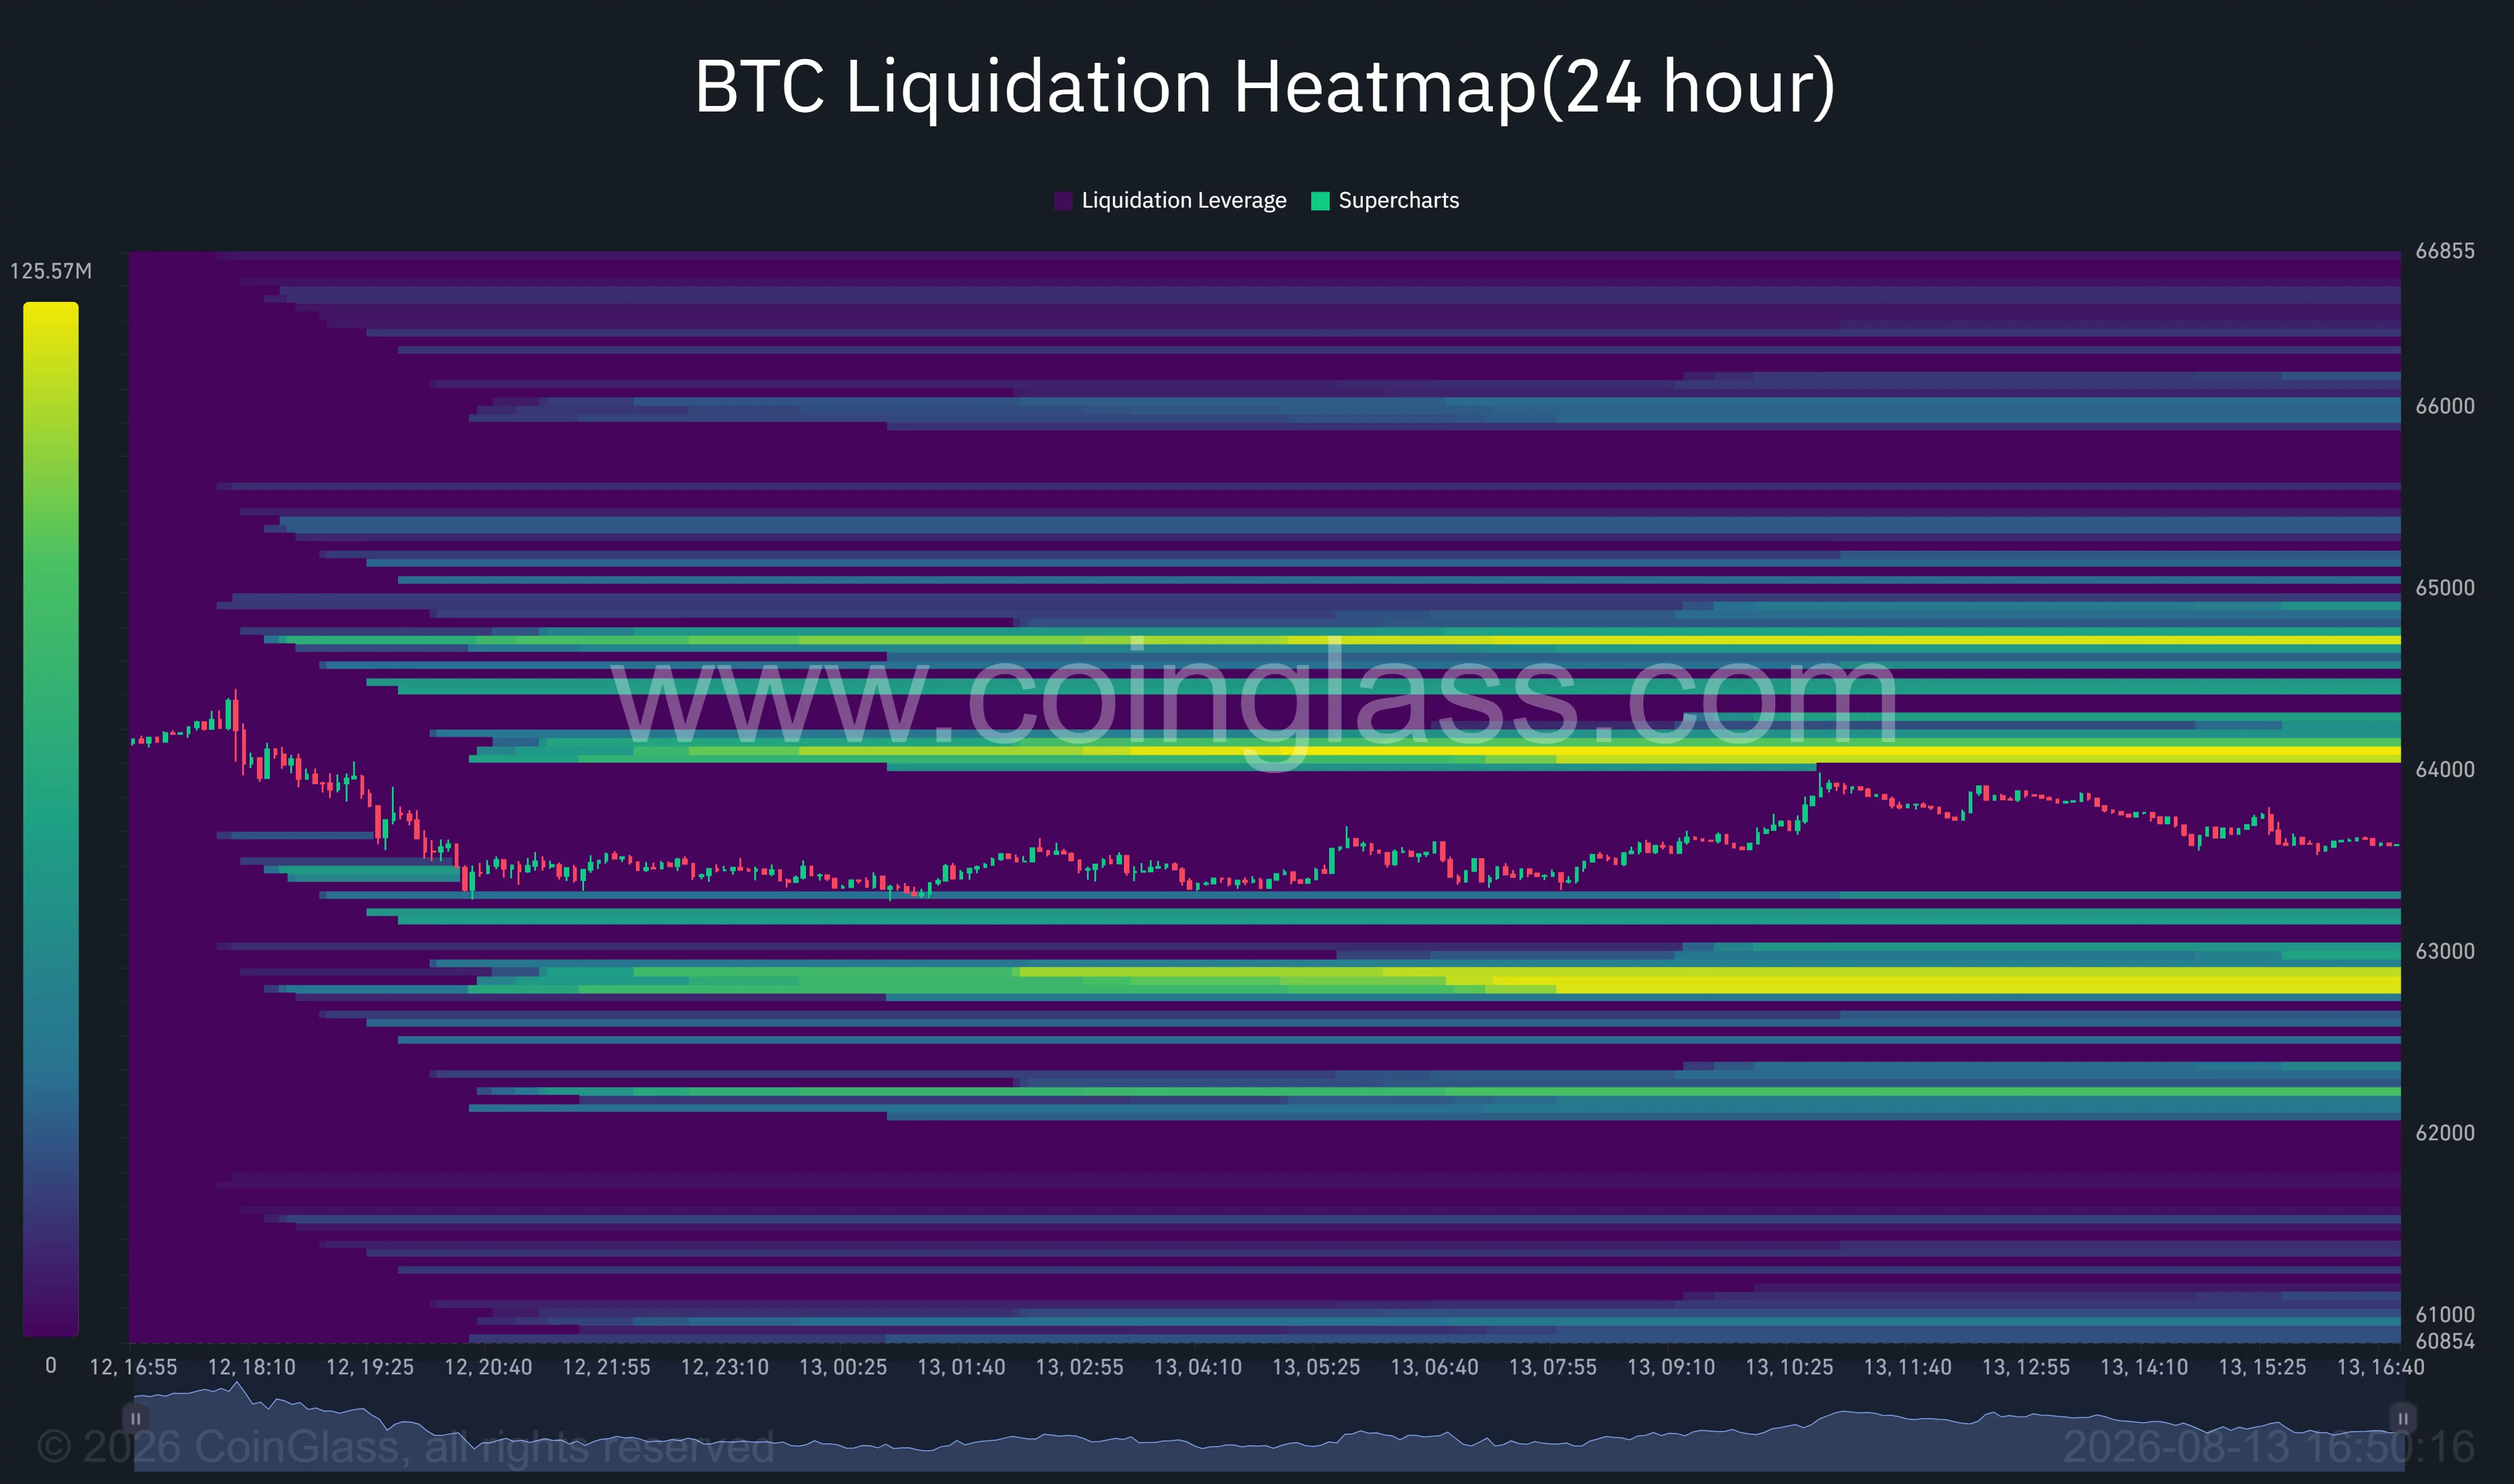
The strongest downside concentration appeared around $62,800–$62,900. Additional liquidity was visible between $62,200 and $62,400, broadly aligning with the support range identified on the price charts.
Bitcoin was positioned almost midway between the major upside and downside pools at the time of analysis. The arrangement leaves the market vulnerable to a liquidity sweep in either direction before a lasting trend develops.
A break below $63,300 would place the $62,800 cluster in focus, followed by the $62,000–$62,500 support zone. Failure to defend that area could expose the late-June low around $59,000 and the major Fibonacci floor at $57,881.
Conversely, a move above $64,000 could trigger a run toward $64,800. BTC would still need to clear $65,000 and $66,460 before the daily chart supports a broader bullish reversal.
On-chain losses add downside risk
Analyst Rain, citing CryptoQuant data, said approximately 45%–46% of Bitcoin’s supply was held at an unrealized loss. Rain described the reading as a sign of advanced holder stress rather than conditions normally associated with a market top.
The analyst also said BTC remained below its 20-day and 50-day exponential moving averages, while the $61,000–$62,000 area represented a key support zone. A decisive failure there could leave room for another decline toward the upper-$50,000 range, according to the analysis.
Unrealized losses do not guarantee capitulation because holders can continue keeping their BTC without selling. However, the metric suggests that a large share of the market has a cost basis above the current price, which may create overhead supply during rebounds.
Bitcoin’s immediate direction now depends on whether buyers protect $63,300 and the deeper $62,000–$62,500 range. Reclaiming $64,800 would reduce the short-term pressure, while a daily close above $66,460 would provide stronger evidence that the broader recovery has resumed.


