


Bitcoin price extended its breakout to $72,490 on Aug. 20 after forced short covering pushed the price through its 200-day moving averages, but an overbought daily reading raises the risk of a pullback.
Summary
- Bitcoin price climbed to an intraday high of $72,490 after breaking above $67,000.
- The price reclaimed its 200-day simple and exponential moving averages near $69,000.
- Daily RSI reached 78.7, placing Bitcoin firmly in overbought territory.
- Liquidation data show the rally cleared several large short-position clusters above $66,000.
Bitcoin price breaks above its 200-day averages
According to data from crypto.news, Bitcoin (BTC) price traded near $71,900 on Binance at the time of writing, up about 3.8% on the daily chart after reaching $72,490 earlier in the session.
The move extended a breakout that began when BTC cleared the $64,000–$66,000 range that had contained the price through much of July and the first half of August. Bitcoin rose from below $65,000 to nearly $70,000 during the first stage of the rally before buyers pushed it above $72,000.
The daily chart shows that Bitcoin has now crossed its 200-day simple moving average at approximately $69,010 and its 200-day exponential moving average near the same level. BTC had remained below both trend indicators since its sharp June decline.
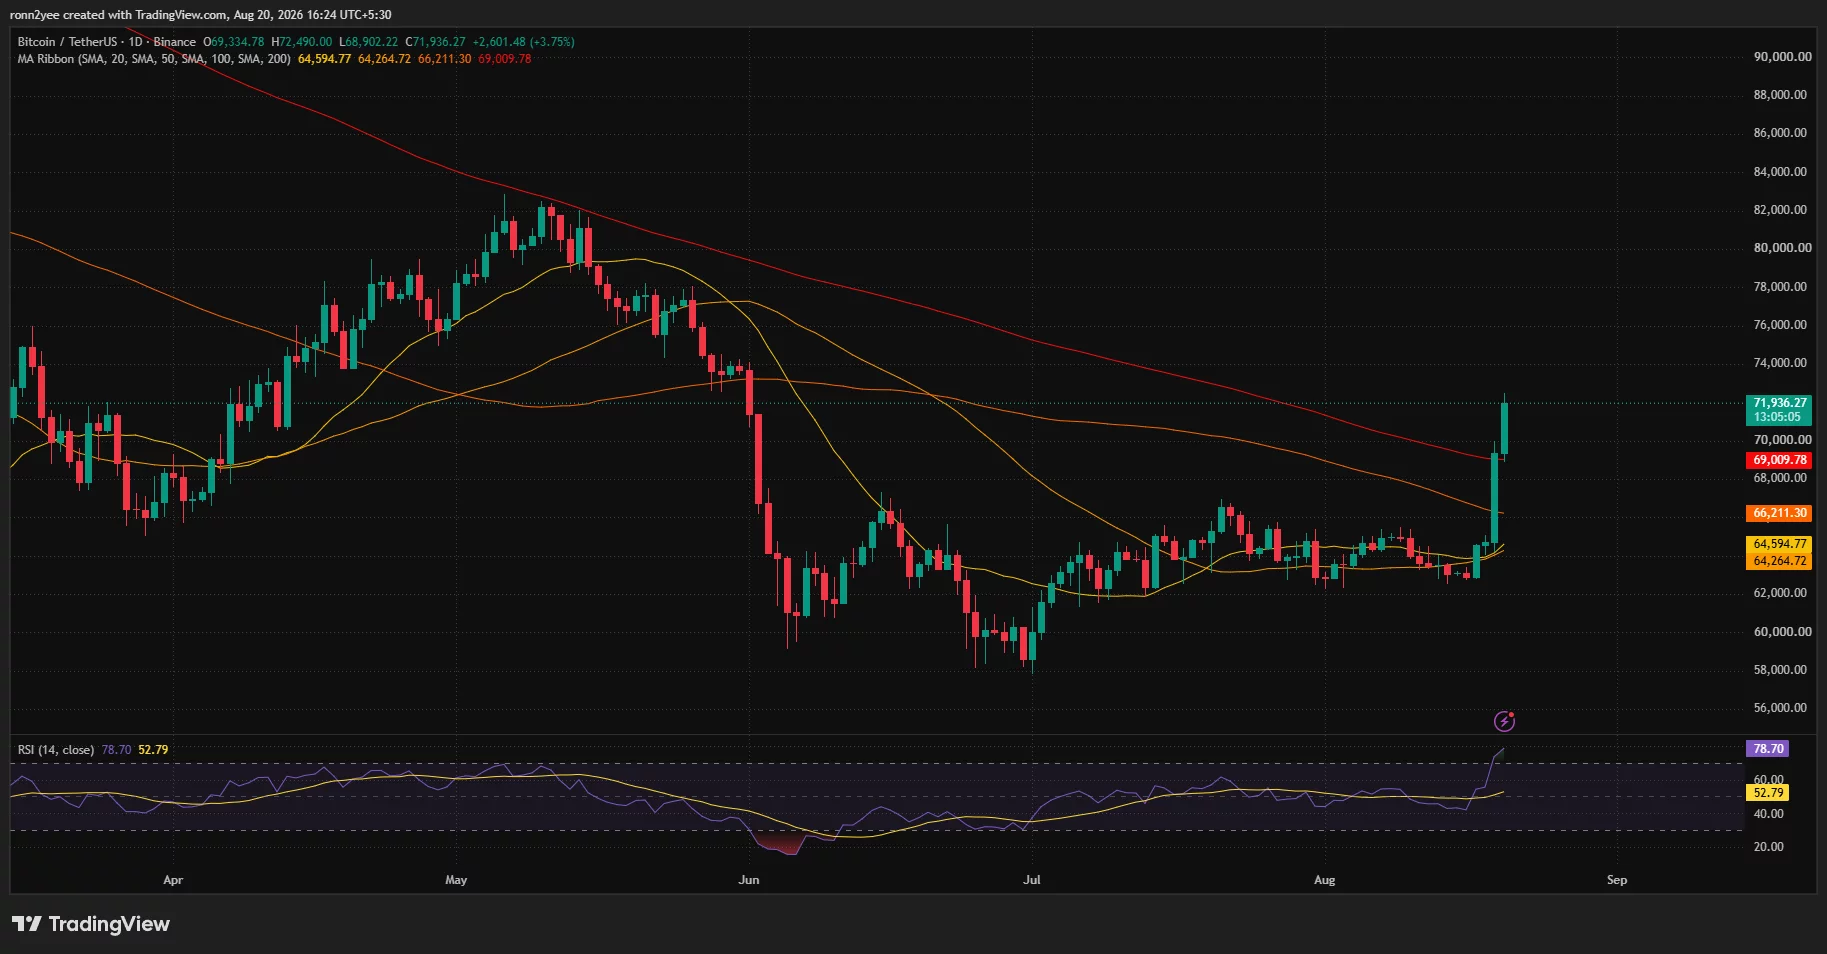
The breakout also took Bitcoin above its shorter moving averages. The 20-day SMA stood at $64,595, while the 50-day and 100-day averages were grouped between $64,264 and $66,211.
That cluster may become a wider support area if the price gives back part of the rally. Holding above the 200-day averages would provide a stronger sign that the move represents more than a temporary derivatives-driven rebound.
Short liquidations accelerated the Bitcoin rally
The one-week CoinGlass liquidation heatmap shows that Bitcoin moved through several layers of leveraged short positions as it crossed $66,000, $68,000, and $70,000.
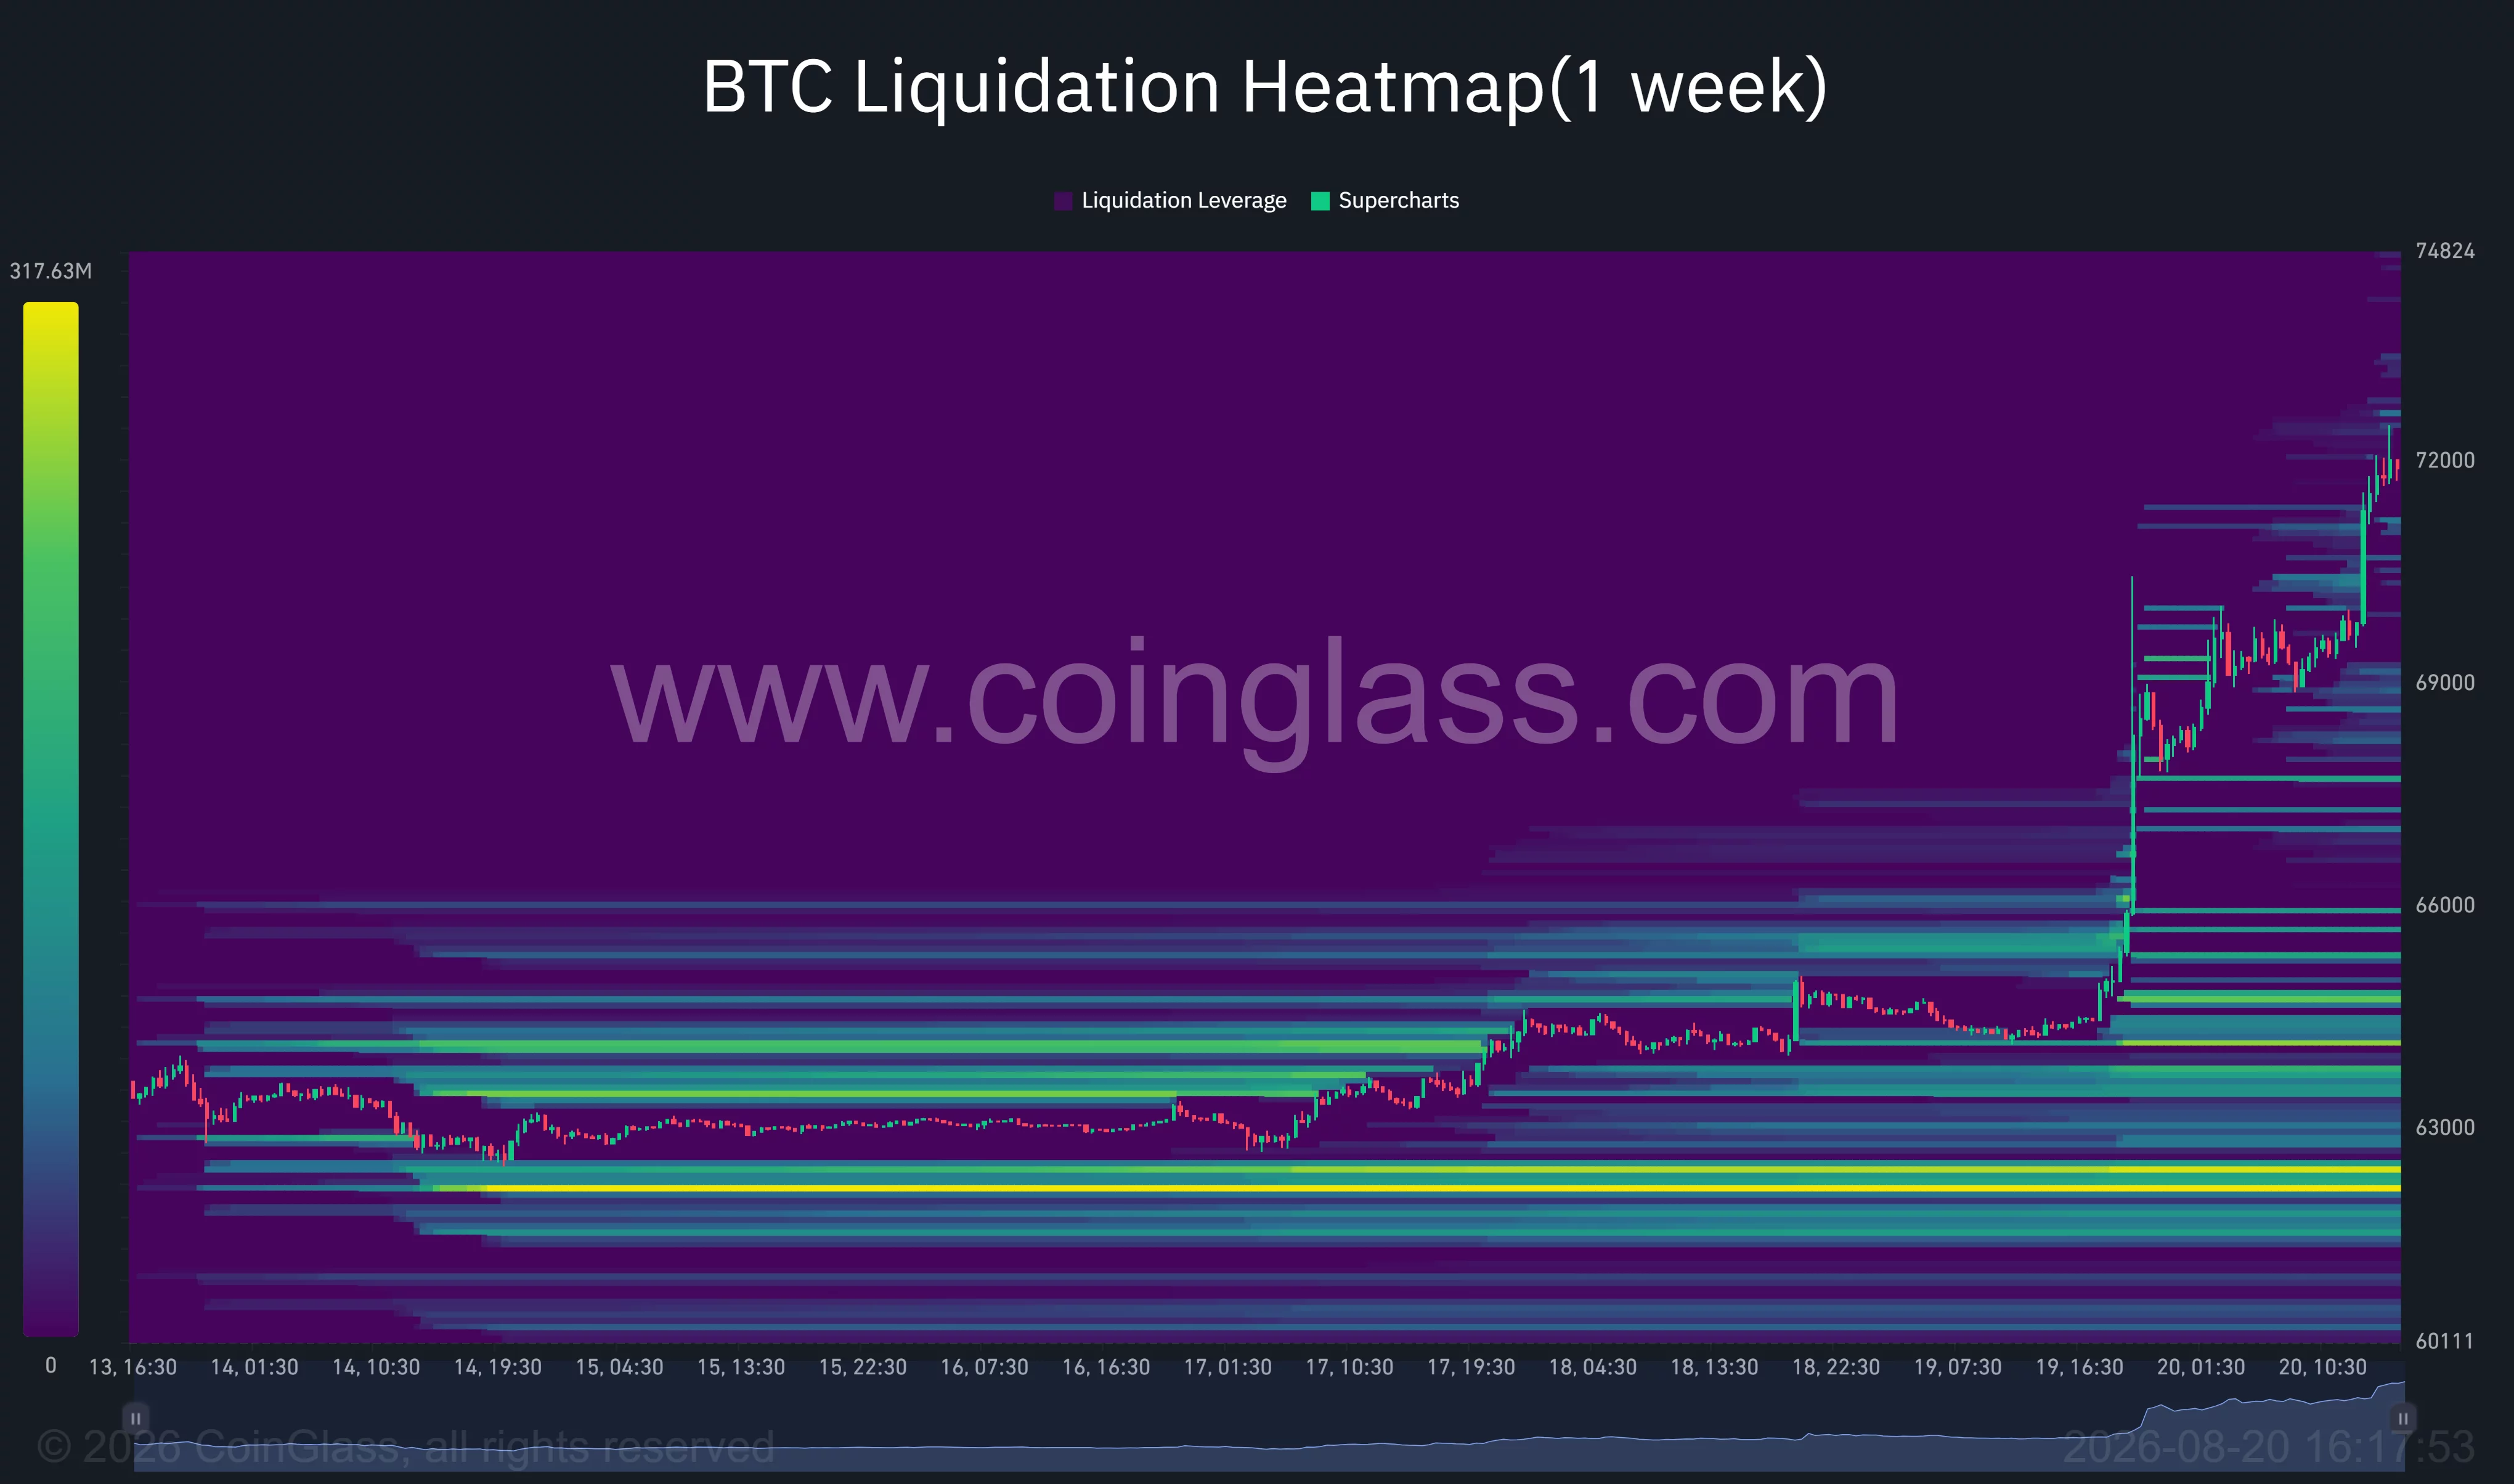
The densest liquidity visible before the breakout was concentrated around $65,000–$66,000. Once Bitcoin crossed that area, forced purchases by traders closing bearish positions helped carry the price toward $69,000.
Further short-liquidation bands between $69,000 and $71,000 added fuel to the advance. The heatmap shows fewer established liquidation clusters above the current price because BTC reached the area rapidly and had spent little time building leveraged positions there.
The rally followed a long period of compression around $63,000–$65,000. Market data supplied with the charts showed more than $1 billion in Bitcoin short liquidations during one hour, and $2.7 billion in bearish positions closed across the broader crypto market.
Liquidations can increase the speed of a move because exchanges automatically buy Bitcoin to close short positions. However, demand generated by forced covering can fade once the largest short clusters have been cleared.
Momentum supports buyers but RSI warns of overheating
Bitcoin’s 4-hour chart remains bullish after the Supertrend indicator flipped positive. Its trailing level has risen to $67,752, placing the first dynamic support roughly 6% below the current price.
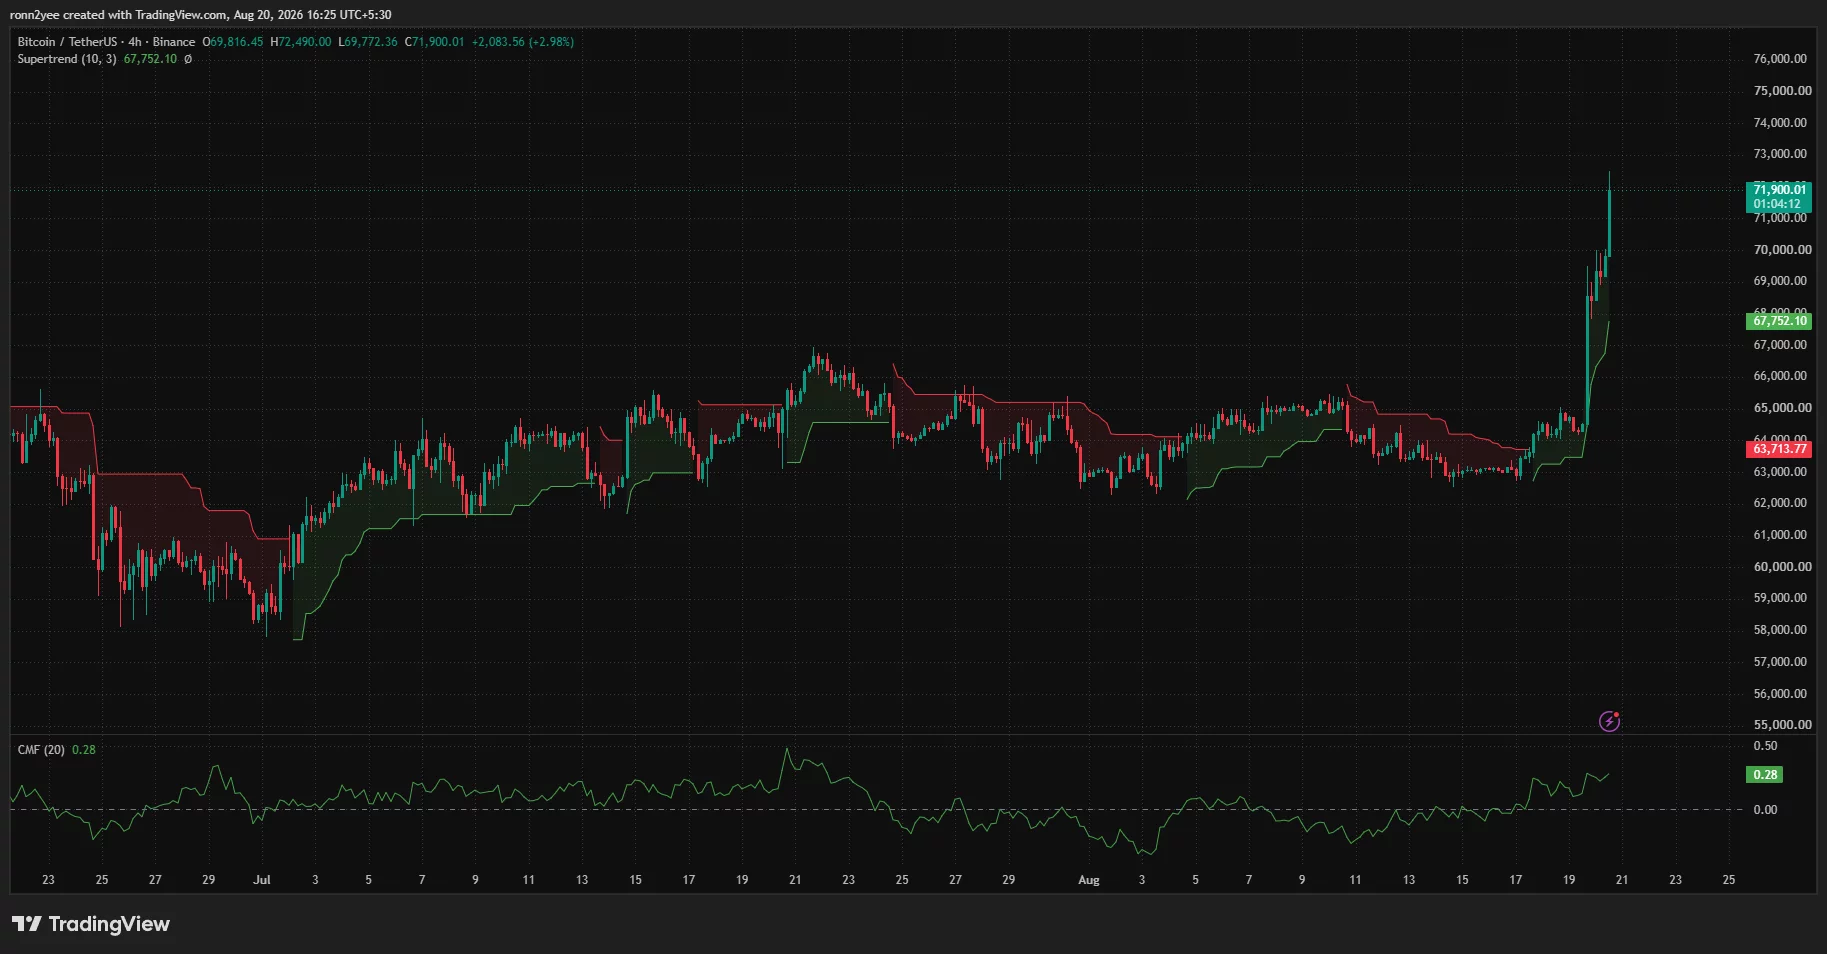
The Chaikin Money Flow reading of 0.28 also shows that buying pressure has accompanied the breakout. A positive CMF reading means more volume has entered Bitcoin during periods when the price closed near the upper part of its trading range.
The daily chart carries a clearer warning. Bitcoin’s 14-day relative strength index jumped to 78.7, well above the 70 level commonly used to mark overbought conditions.
An overbought RSI does not require an immediate reversal, especially during a short squeeze. It does show that the rally has moved faster than its recent trend, increasing the chance of consolidation or profit-taking.
The latest daily candle also produced a high near $72,490 before the price eased below $72,000. Buyers must therefore turn the $69,000–$70,000 region into support to prevent the breakout from becoming a brief move above the 200-day averages.
Analysts watch $67K and $65K for a pullback
Crypto trader Daan Crypto Trades said in an Aug. 20 X post that Bitcoin had made a higher high and was testing its daily 200-day moving-average region.
Daan placed the move inside a wider $60,000–$80,000 range and said the trend had improved on the daily chart. However, the trader expected volatility to remain elevated after Bitcoin escaped the compressed range.
Lennart Snyder offered a more cautious assessment in a separate X post. Snyder said Bitcoin had entered a larger range but remained below important resistance, leading him to favor waiting for the price to settle before opening a new position.
Snyder identified the midpoint of the breakout candle around $67,000 as one area where momentum traders could look for support. He placed a deeper potential buying zone at $65,000–$66,000, near the upper boundary of Bitcoin’s former consolidation range.
Those levels broadly match the technical charts. The 4-hour Supertrend stands near $67,752, while the daily moving-average cluster between $64,264 and $66,211 could offer support during a larger retracement.
On the upside, a sustained close above $72,500 would leave the $74,000 area as the next nearby psychological level. Bitcoin would then face a broader supply region between $78,000 and $80,000, where the market traded before the June sell-off.
US liquidity and ETF demand remain key
The breakout came as US Treasury yields and the dollar pulled back following the Treasury Department’s reported plan to increase long-dated bond buybacks from $2 billion to at least $4 billion per operation in September.
Lower yields can support non-yielding assets such as Bitcoin by reducing the relative return available from government bonds, though the derivatives data indicate that forced short covering was a major immediate driver of the rally.
Data from SoSoValue also showed $517 million in net inflows into US spot Bitcoin exchange-traded funds on Aug. 19. Continued ETF demand would offer stronger evidence that institutional buying is replacing the short squeeze as the source of support.
A renewed rise in US yields, weaker ETF flows, or a daily close below $69,000 would weaken the breakout. Holding the 200-day averages while the RSI cools would give buyers a firmer base for another attempt above $72,500.
Disclosure: This article does not represent investment advice. The content and materials featured on this page are for educational purposes only.