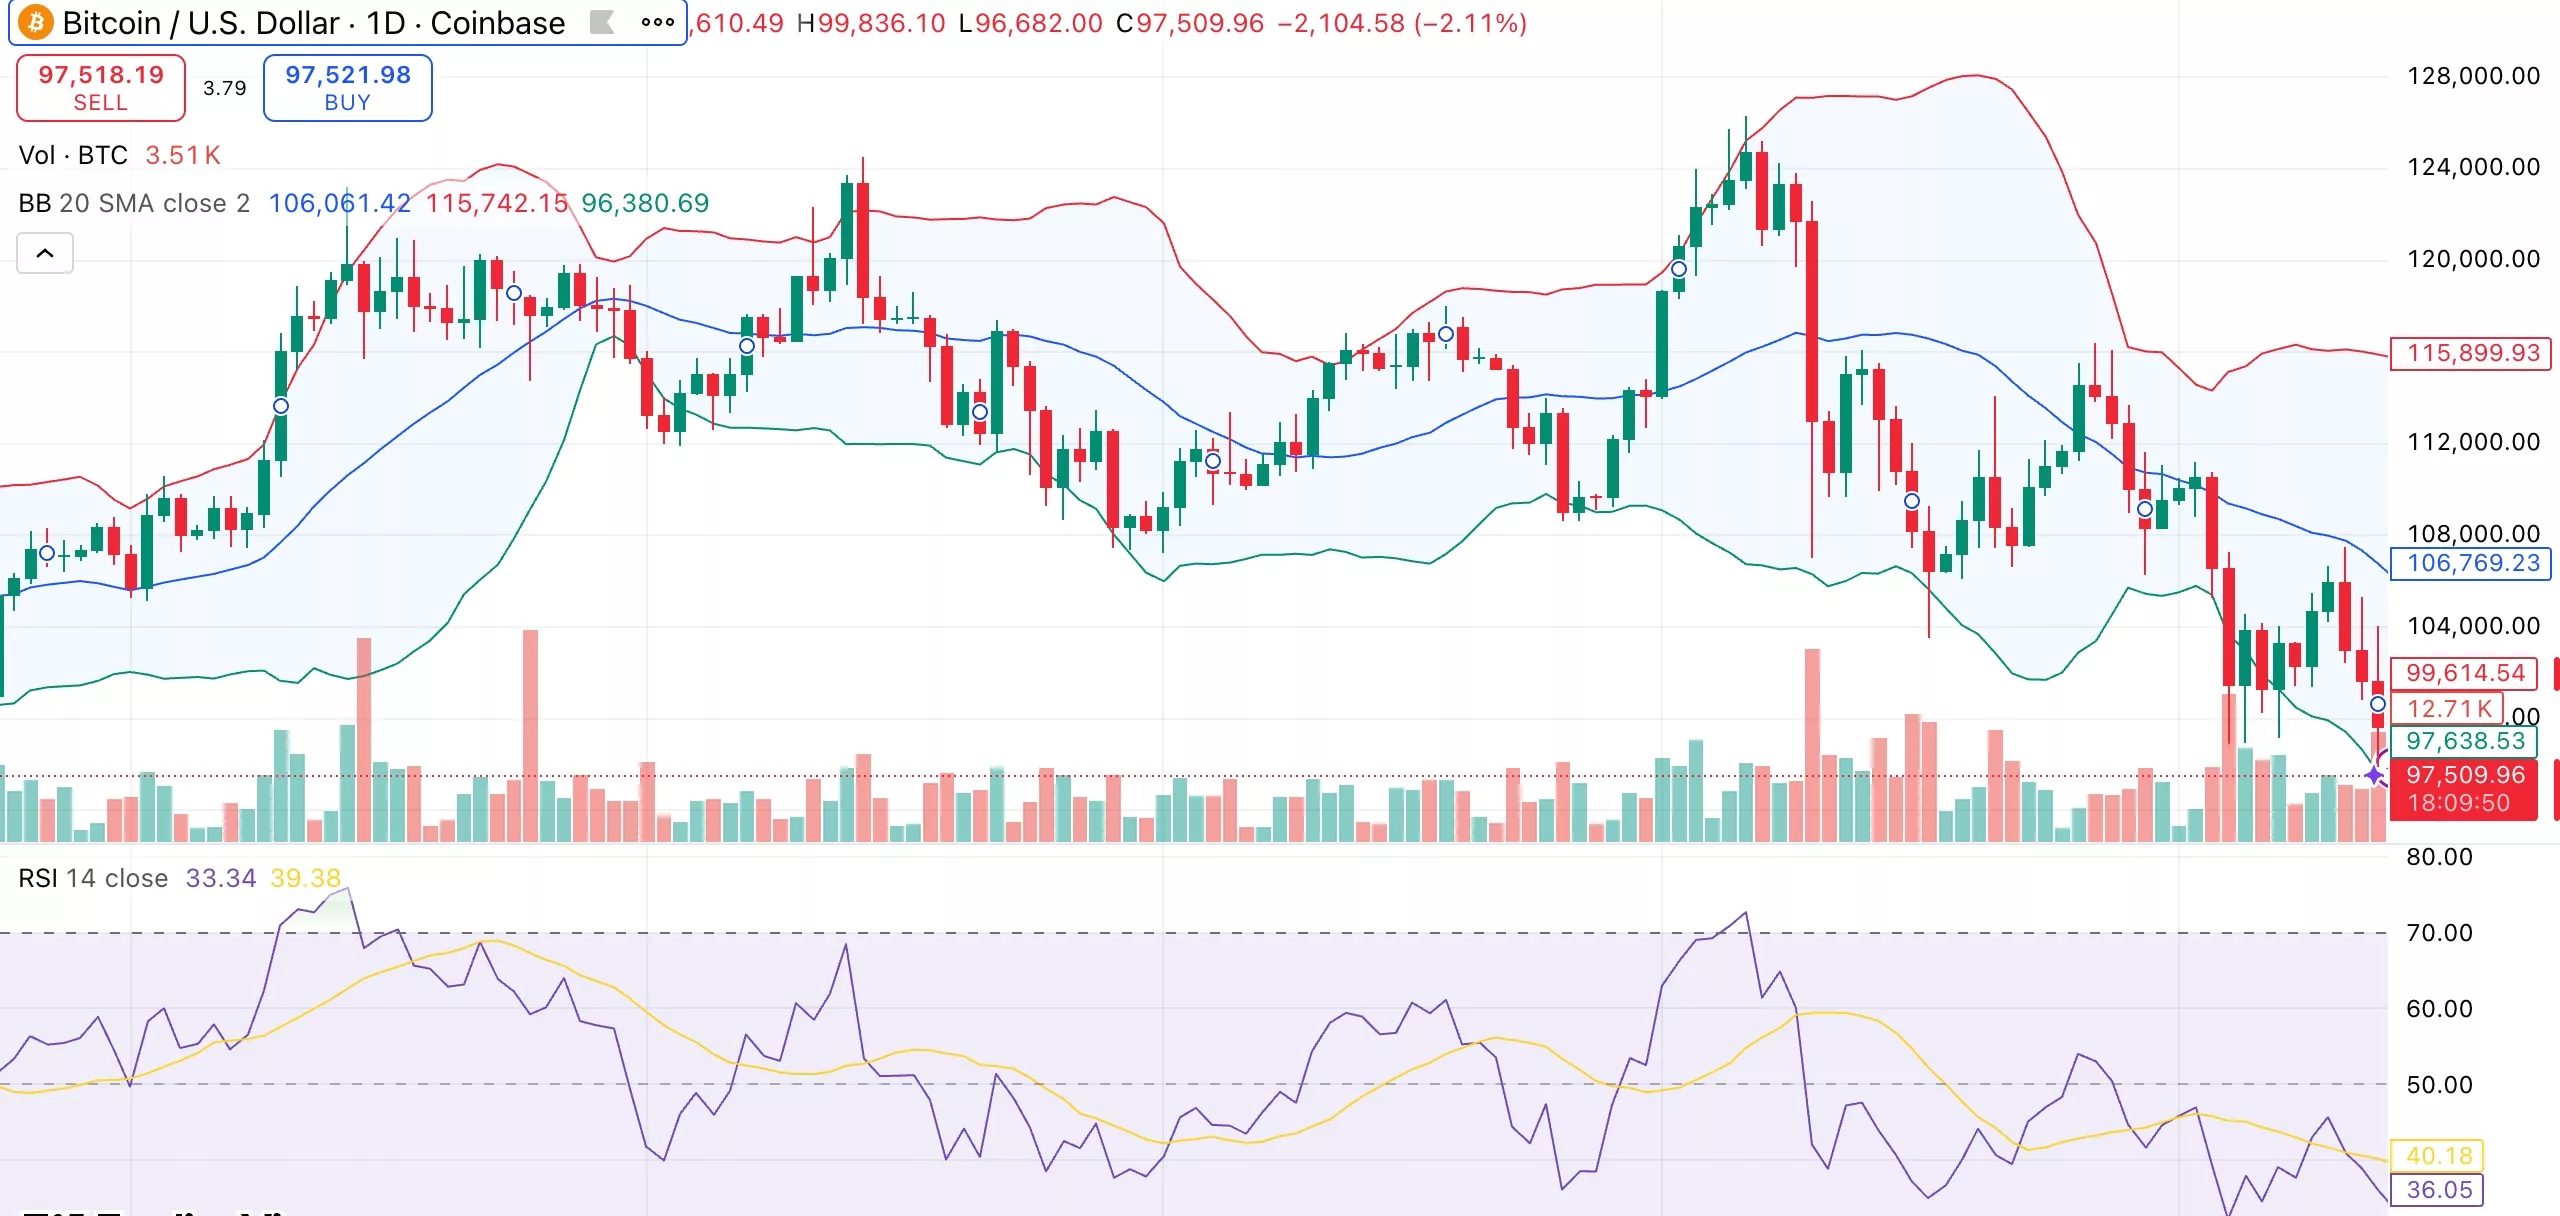
Bitcoin price is hovering around $97,000 as heavy exchange-traded fund outflows deepen market pressure.
Summary
- Bitcoin faces sharp outflows and rising U.S.-driven sell pressure.
- ETF redemptions accelerate as institutions de-risk into year-end.
- Technical signals lean bearish with key support now under stress.
Bitcoin is trading at $97,527 at press time, down 5.5% in the past 24 hours. The market has now declined 4.3% in the past week, shed 13% in the past month, and retreated 22% from its October peak at $126,080.
Trading volume jumped 50% in the last 24 hours, showing a rise in market activity during the pullback. Derivatives activity also picked up. Total futures volume rose more than 34% to $153 billion, while open interest dipped 2% to $66.65 billion. This likely suggests that the market is resetting rather than forming a strong directional trend.
Spot BTC ETF outflows accelerate
U.S. spot Bitcoin ETFs registered $869 million in net outflows on Nov. 13, the second-largest single-day withdrawal on record after that of Aug. 1. Grayscale’s Mini BTC led with more than $318 million in outflows, followed closely by BlackRock’s IBIT with $257 million, and Fidelity’s FBTC with $119 million.
Large redemptions of this size usually indicate institutional de-risking and can add short-term pressure by reducing spot demand.
Gerry O’Shea, head of global market insights at Hashdex, told crypto.news that Bitcoin’s consolidation stems from both macro shifts and long-term holder selling. He said that expectations for a December rate cut have faded and that many long-term holders in the U.S. are securing profits near year-end.
O’Shea added that the lower volatility since ETF approvals suggests Bitcoin is moving into more structured, institutional hands, with long-term demand still stable despite recent weakness.
U.S. market forces responsible for decline
CryptoQuant analysts noted that the recent price action is driven mainly by U.S. market forces. The Coinbase Premium Index has been negative for weeks, meaning Bitcoin trades cheaper in the U.S. than abroad. This reflects stronger American selling and matches the pattern of overnight recoveries followed by U.S.-hour declines.
Long-term holders across almost every age group have also been selling. The analysts believe this indicates widespread tax positioning among U.S. investors. Fidelity also commented that many long-term holders are closing profitable positions heading into year-end.
Macro conditions added to the pressure. The recent U.S. government shutdown resulted in a short-term fiscal surplus and tightened liquidity. Demand for risk assets declined sharply as a result of weaker U.S. equities, a pullback in crypto-related stocks, and lower expectations for rate cuts. Once liquidity stabilizes, analysts expect conditions to improve.
Bitcoin price technical analysis
With its price trading below all of the major moving averages from the 10-day to the 200-day level, Bitcoin is still in a clear downward trend. There is strong resistance between $102,000 and $110,000.
The price is still hovering close to the lower Bollinger Band, indicating both short-term exhaustion and ongoing selling.

Momentum indicators show some weakness. Nearing oversold conditions, the relative strength index is at 33, and the MACD and awesome oscillator are still negative. A few short-term indicators show slight improvement, hinting that pressure may be easing.
Support in the range of $96,500 to $97,000 is still crucial. A breakdown might pave the way for $92,000 or even the $88,000–$90,000 range. For any recovery to hold, Bitcoin must reclaim $102,000 and then test stronger resistance at $106,000 and $110,000.


