

BNB price traded near $605 on Aug. 10 after reclaiming the psychological $600 level, with improving momentum and nearby liquidation clusters raising the prospect of another short squeeze.
Summary
- BNB price traded at $605, slightly above its 100-day moving average near $604.85.
- Daily RSI climbed to 65.15, showing stronger demand without entering overbought territory.
- 4-hour Supertrend support rose to $593.86, making $594–$600 the key defense zone.
- Liquidation data shows concentrated short exposure around $618–$623, with downside liquidity near $598.
BNB reclaims $600 after its July recovery
According to data from crypto.news, BNB (BNB) price extended its recovery on Aug. 10, trading around $605 after reaching an intraday high near $606.84. The token has now moved above $600, a level that repeatedly limited gains during the previous sessions.
The daily chart shows BNB recovering from a late-June low near $540. Buyers gradually returned through July before accelerating the move during the first 10 days of August. The price has gained roughly 12% from the June bottom and is attempting to establish a higher-high structure.
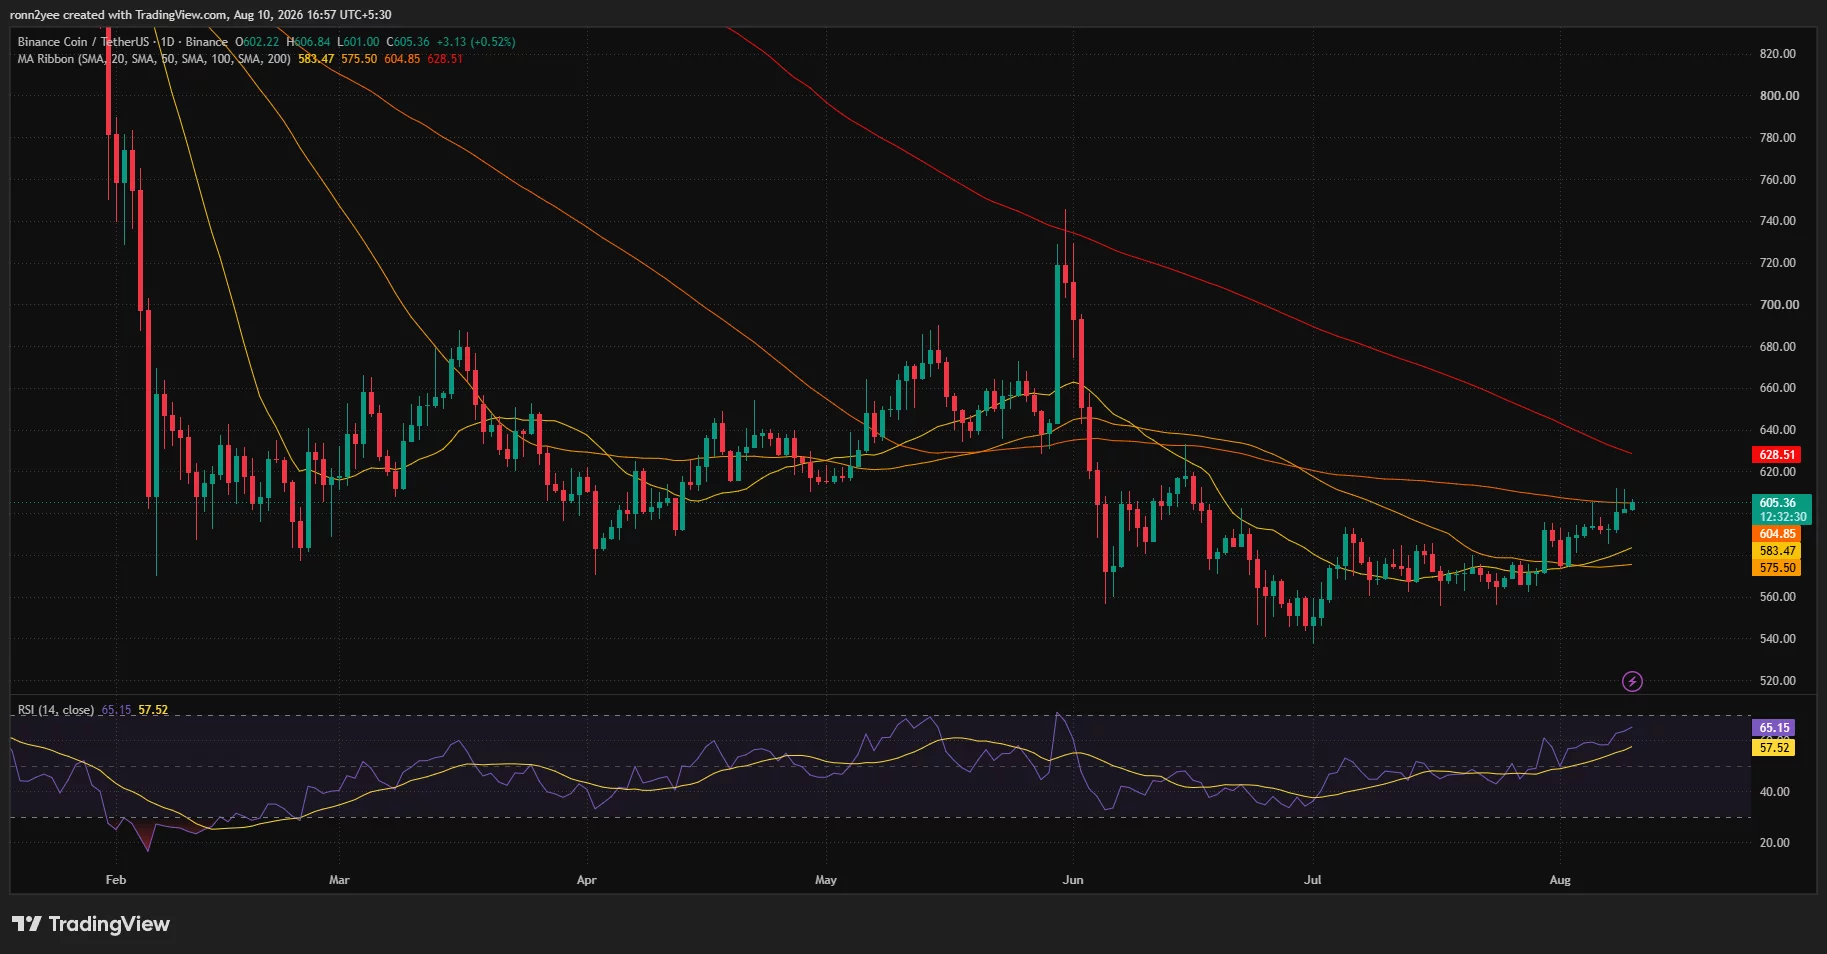
Momentum has also improved. The daily Relative Strength Index rose to 65.15, above its signal average of 57.52. An RSI reading below 70 suggests that buying pressure is increasing, but BNB has not yet entered technically overbought territory.
Still, the move has not produced a decisive breakout. BNB remains near a group of resistance levels between $605 and $610, where repeated intraday rejections show that sellers remain active.
Moving averages support the rebound, but volume lags
The latest advance appears primarily technical. BNB has reclaimed its 20-day and 50-day moving averages, currently positioned near $583.47 and $575.50, respectively. Both levels now sit below the market and could provide support during a pullback.
BNB is also testing its 100-day moving average near $604.85. A sustained daily close above this line would strengthen the recovery case and shift attention toward the 200-day moving average at $628.51.
The 4-hour chart supports the short-term bullish setup. BNB remains above the Supertrend indicator, which has moved up to $593.86. The indicator flipped bullish in late July and has continued to track the price higher.
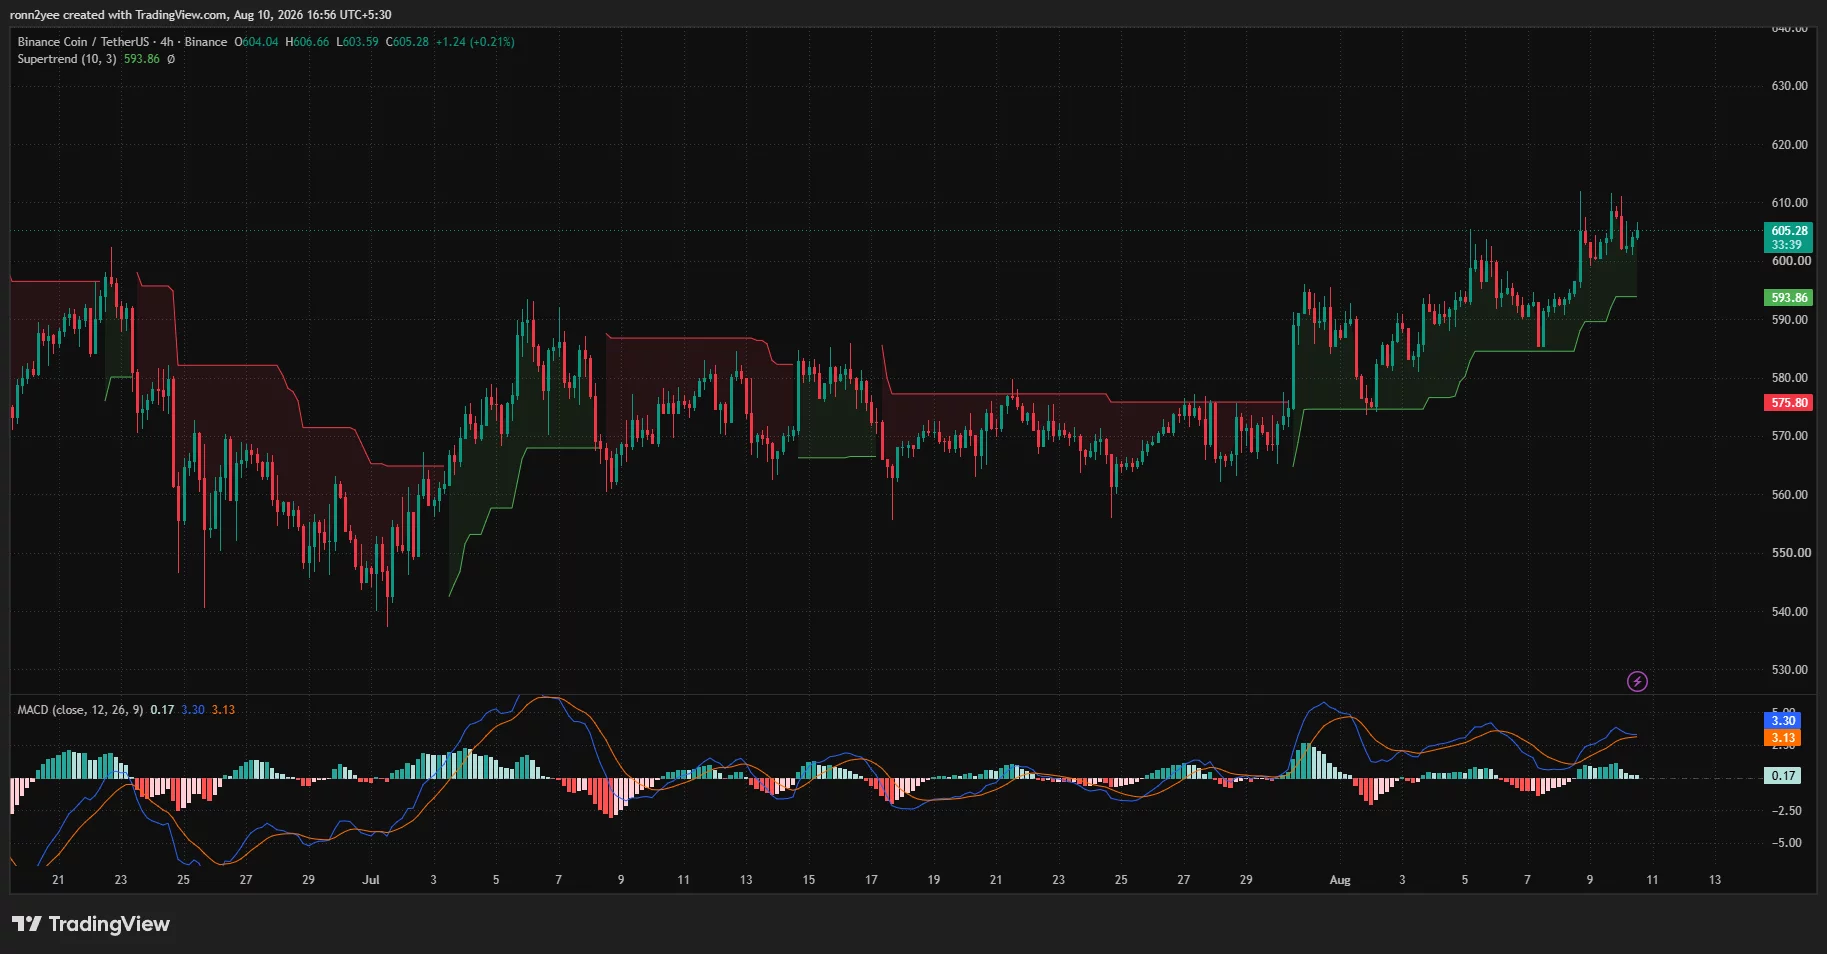
The Moving Average Convergence Divergence indicator remains positive, with the MACD line at 3.30 and the signal line at 3.13. However, the histogram has narrowed to 0.17, suggesting that upward momentum is slowing as BNB tests resistance.
Thin follow-through therefore remains a risk. A lack of stronger buying volume could keep the token within its current range even if it continues to hold above $600.
Liquidation clusters put $623 within reach
BNB’s immediate resistance sits between $606 and $610, covering recent intraday highs. A 4-hour close above $610 could clear the latest supply zone and open a path toward the first major liquidation cluster around $618–$620.
The 3-day liquidation heatmap shows an even larger concentration of leveraged positions near $622–$623. If BNB breaks $610 with increasing volume, forced closures of short positions could accelerate the move into this zone.
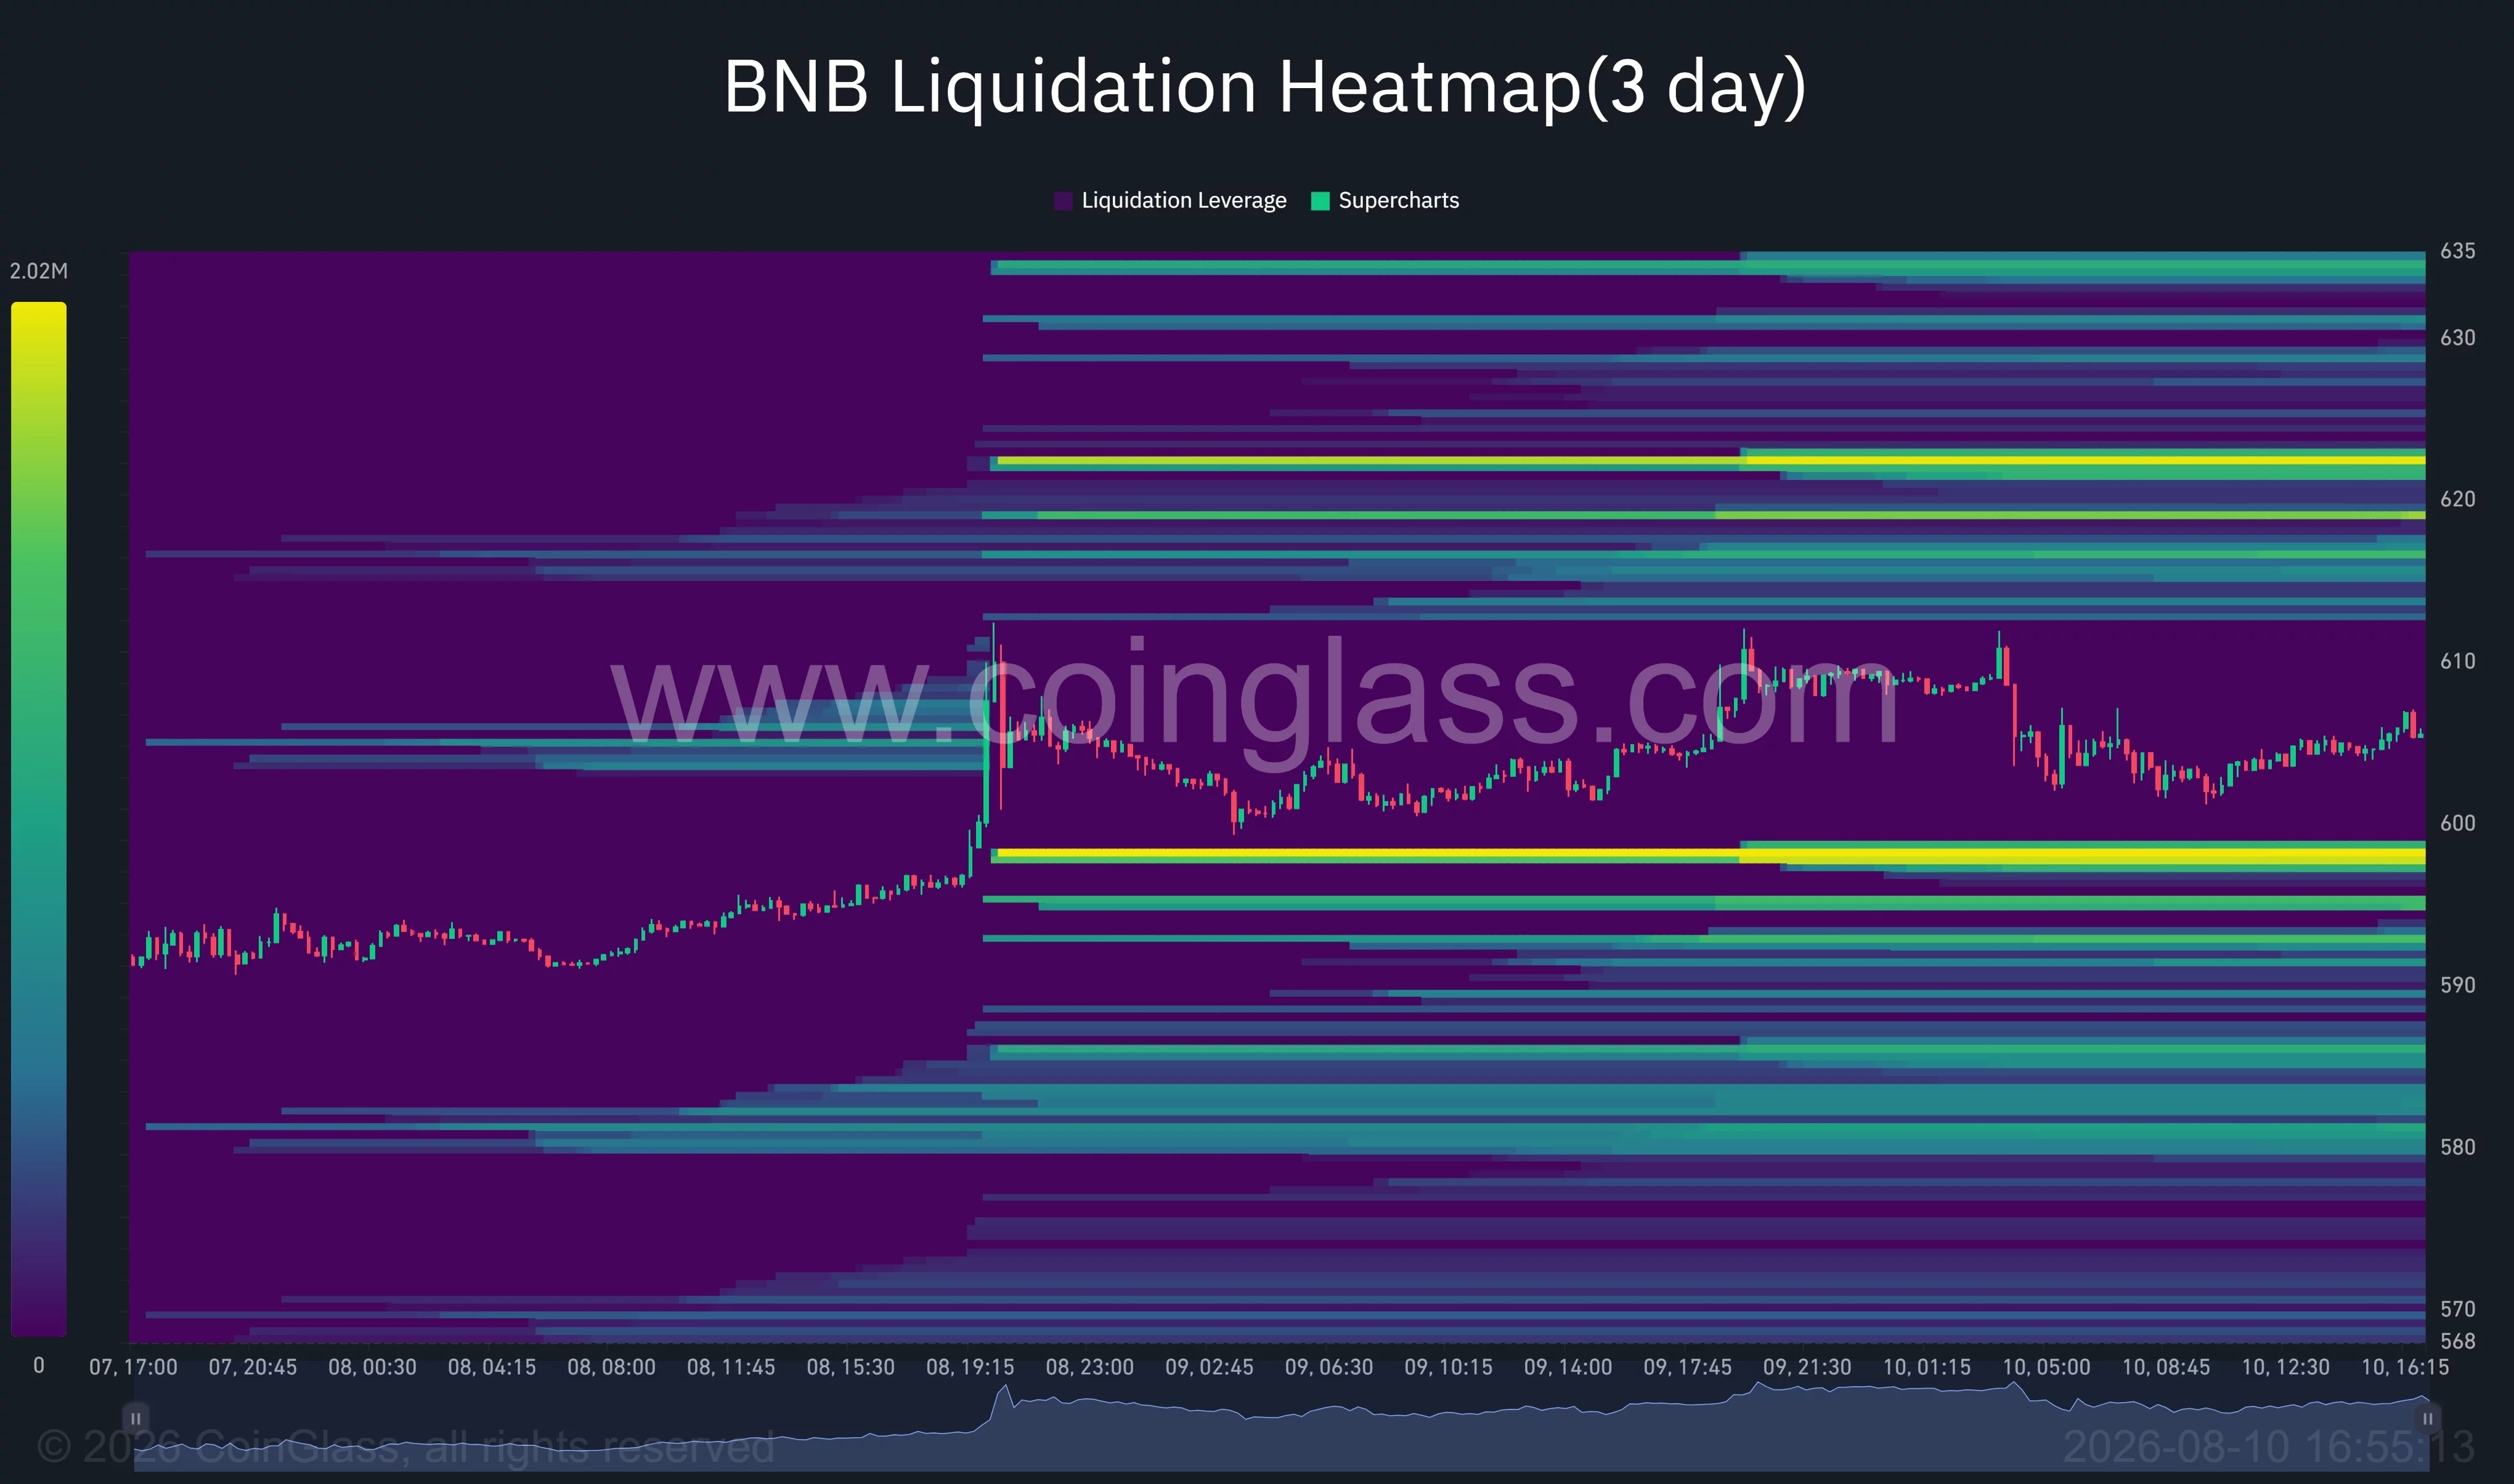
Beyond that, the 200-day moving average at $628.51 represents the main daily resistance. Additional liquidity appears near $630 and $635, making the broader $628–$635 region a difficult area for bulls to clear.
On the downside, the closest liquidity pool is around $598. That level sits just below the psychological $600 mark and could attract price during a short-term correction.
The Supertrend at $593.86 provides the next support. Losing that level would weaken the 4-hour structure and expose the 20-day moving average at $583.47. The 50-day moving average near $575.50 would become the deeper invalidation level for the current recovery.
Analyst maps a longer-term path toward $780
Crypto commentator DongPham said BNB has recorded three constructive weekly closes but remains in a broader retracement after losing a long-term uptrend around $673 in February.
The analyst identified $780–$790 as a possible longer-term retest area. Reaching that target would require BNB to first reclaim the $628–$635 resistance zone and then break above the former trend level near $673.
DongPham also noted that trading volume had not increased alongside the latest recovery. That divergence matters because a price rise without stronger participation may struggle to continue through multiple resistance levels.
The short-term charts support a more measured target. BNB first needs to hold $600 and close above $610 before the liquidation clusters at $618–$623 become attainable. The $780–$790 projection remains a longer-term scenario rather than an immediate target.
Losing $594 could invalidate the bullish setup
For US traders, BNB remains sensitive to broader moves in Bitcoin, Ethereum and global risk assets. Changes in US interest-rate expectations, Treasury yields and the dollar can affect demand for higher-risk crypto assets even when BNB’s immediate setup is driven by technical levels.
BNB also carries exchange-specific risk because of its close association with the Binance ecosystem. Its availability and liquidity can differ across US trading platforms, so American investors may face different spreads and execution conditions from traders using global exchanges.
The short-term bias remains constructive while BNB stays above $593.86. A confirmed break above $610 could trigger a move toward $618–$623, while failure to defend $598 would put the current breakout attempt at risk.
Disclosure: This article does not represent investment advice. The content and materials featured on this page are for educational purposes only.