


Cardano price has slipped below $0.25 as daily momentum weakens, putting the $0.224–$0.240 support zone at the center of its recovery outlook.
Summary
- Cardano price traded near $0.2434, with its daily price change showing a 3.53% decline.
- Daily MACD turned negative on the histogram as the indicator slipped below its signal line.
- Analyst Jesse Olson flagged bearish divergence, while another analysis identified support at $0.224–$0.240.
- CoinGlass showed prominent overhead liquidation concentrations around $0.258–$0.262, above ADA’s latest trading price.
TradingView’s Binance ADA/USDT daily chart placed Cardano at approximately $0.2434 on Oct. 12, with a session high of $0.2561 and a low of $0.2411. The decline pushed ADA below the $0.25 level after its early-October advance approached the upper boundary of a rising channel.
The daily chart shows a recovery from roughly $0.14 in late June, followed by higher price swings through August, September, and early October. Despite the latest pullback, ADA remained well above that June trough.
The immediate question is whether buyers can preserve the recovery’s support structure after the rejection near $0.27–$0.28. Two analyst assessments point to different outcomes, with one warning of further retracement and the other outlining a recovery scenario that depends on support holding.
Cardano’s daily momentum weakens below $0.25
On TradingView’s daily chart, ADA retreated after reaching the rising channel’s upper boundary near its early-October high. Price remained inside the drawn channel, although the decline moved it away from the upper resistance line.
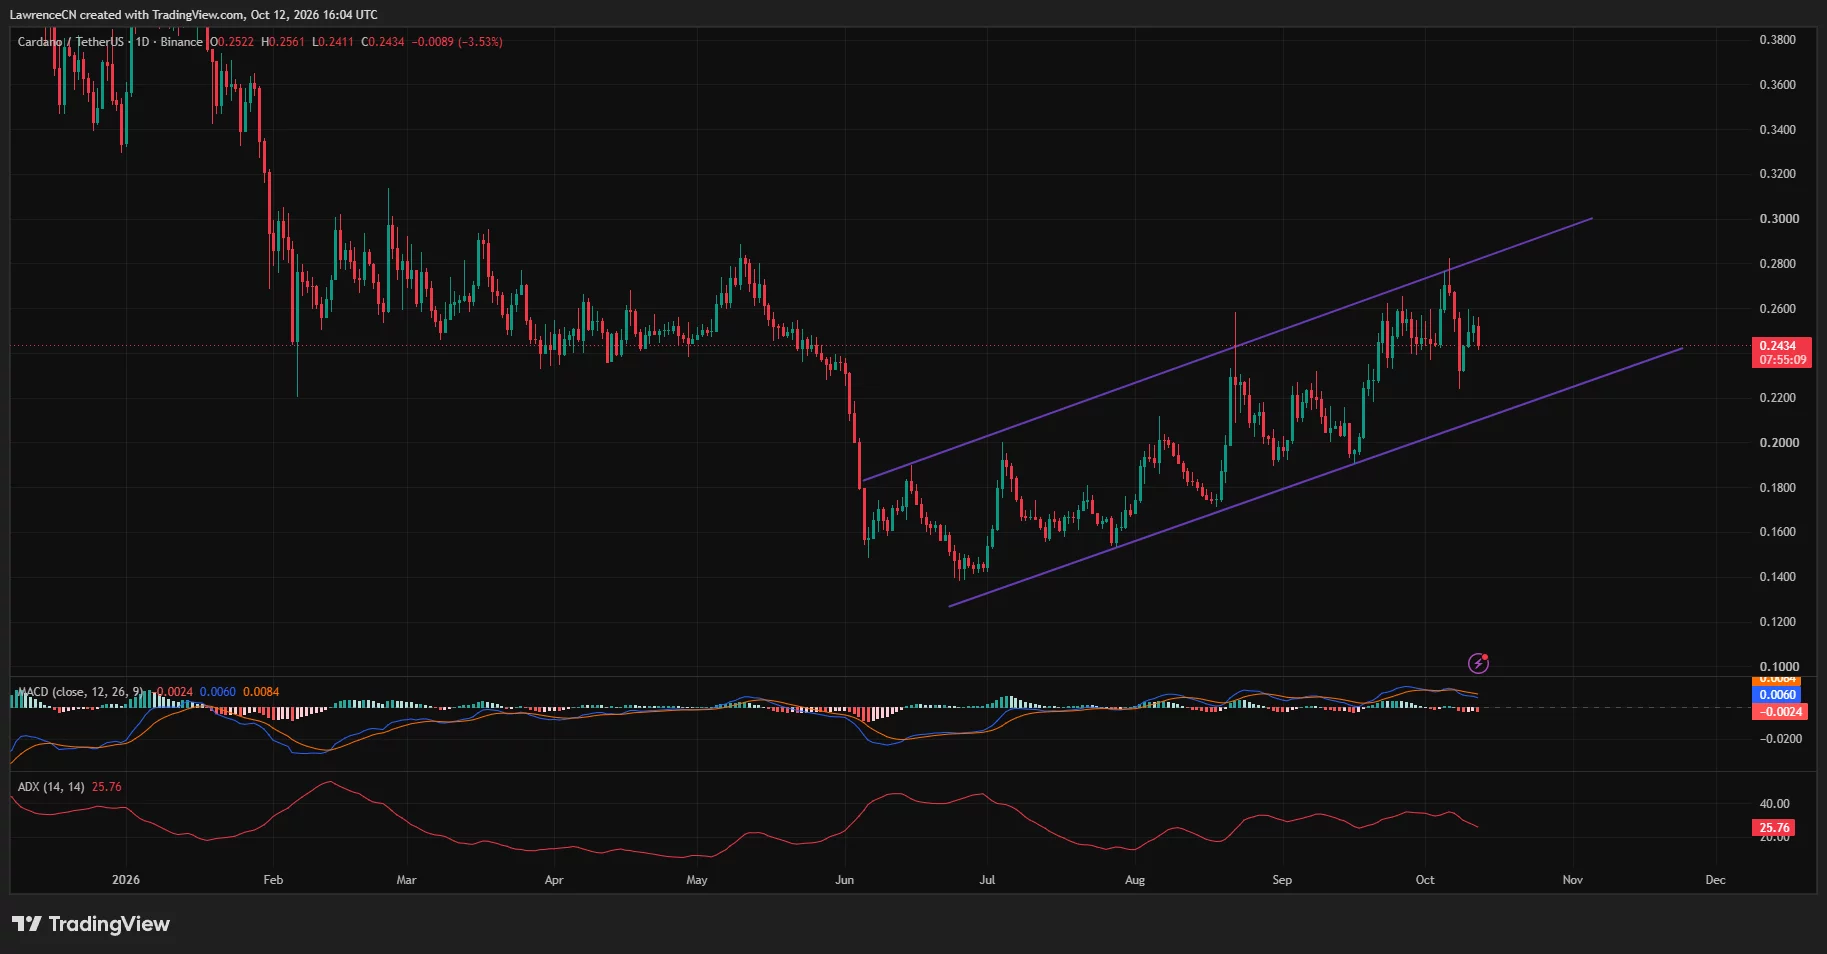
The channel’s lower boundary runs beneath the recent candles, around the low-$0.22 region on the current portion of the chart. ADA therefore remained above that trend line at the time of the snapshot, even as its latest daily move added pressure to the recovery.
Daily momentum readings showed a clearer deterioration. The moving average convergence divergence indicator, or MACD, stood at 0.0060, below its signal line at 0.0084.
The resulting histogram reading was negative at approximately -0.0024. The MACD line remained above zero, but its position below the signal line showed that recent upward momentum had weakened.
TradingView’s average directional index stood at 25.76 and had fallen from its recent readings. ADX measures trend strength rather than direction, so the reading alone does not establish whether buyers or sellers control the next move.
Taken together, the daily chart showed a pullback within a broader rising structure alongside weaker momentum. A confirmed loss of the channel’s lower boundary would represent a separate technical development from the retreat already visible below $0.25.
Analysts split over the $0.224–$0.240 support zone
Analyst Jesse Olson described ADA’s daily outlook as bearish in an Oct. 12 post, citing bearish divergence and a potential lower high.
“Two of four retracement targets have been hit so far.”
Olson’s chart marked several retracement areas below the recent peak. His assessment focused on the risk that the rebound following the initial sell-off would form a lower high, leaving ADA exposed to another downward move.
A separate analysis published under the name Giannis Andreou outlined a recovery scenario built around the $0.224–$0.240 demand zone. That assessment identified the 0.382 Fibonacci retracement near $0.2271 inside the same area.
According to the analysis, a return to that zone followed by stabilization could establish another higher low before a fresh attempt at $0.281. The scenario therefore depends on buyers defending support rather than an immediate return to the early-October peak.
The same assessment placed $0.2105 and the 0.618 Fibonacci level near $0.1939 below $0.224. It identified a daily close below $0.19 as a development that would substantially weaken the recovery outlook.
On the upside, the analysis required a confirmed daily breakout above $0.281 and a successful retest before strengthening the case for $0.3147. Further resistance targets stood at $0.3880 and $0.4844.
The highest target represented approximately 92.3% upside from the analyst’s reference price of $0.2519. That projection was conditional on the support and breakout sequence described in the analysis.
Weekly resistance remains near $0.269
TradingView’s weekly chart placed ADA near $0.2435, below the upper Bollinger Band at $0.2688. The recent advance reached the vicinity of that upper band before price pulled back.
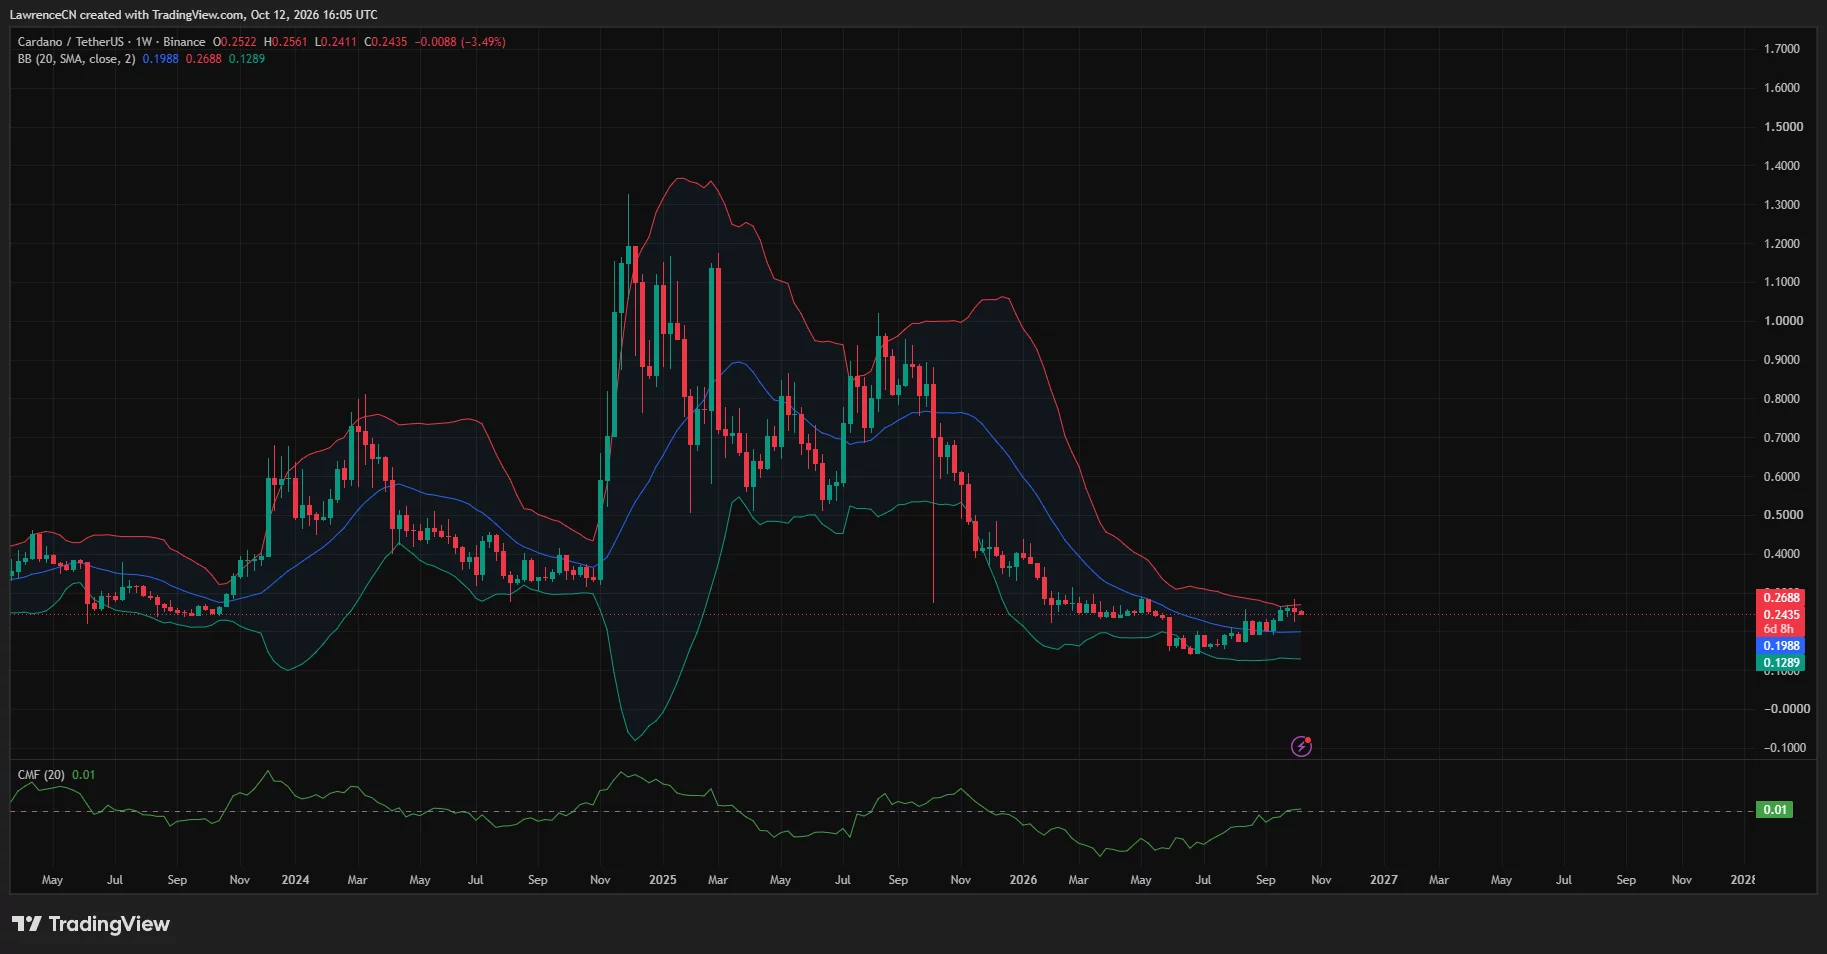
The weekly Bollinger midpoint, a 20-week simple moving average, stood at $0.1988. The lower band was approximately $0.1289.
ADA remained above the midpoint despite the latest decline. However, the weekly chart also showed how far the token remained below the much higher prices recorded during its late-2024 and early-2025 rally.
Weekly Chaikin Money Flow stood at approximately 0.01, just above zero after recovering from negative territory. The reading showed only a small positive balance in the indicator’s volume-weighted measure of buying and selling pressure.
The weekly chart consequently presented a different timeframe from Olson’s daily warning: price remained above its 20-week average while facing resistance near the upper Bollinger Band.
Liquidation concentrations sit above ADA’s price
CoinGlass’s three-day liquidation heatmap showed ADA falling from the mid-$0.25 region toward $0.243 by the end of the period. Price moved through several nearby concentrations during the decline.
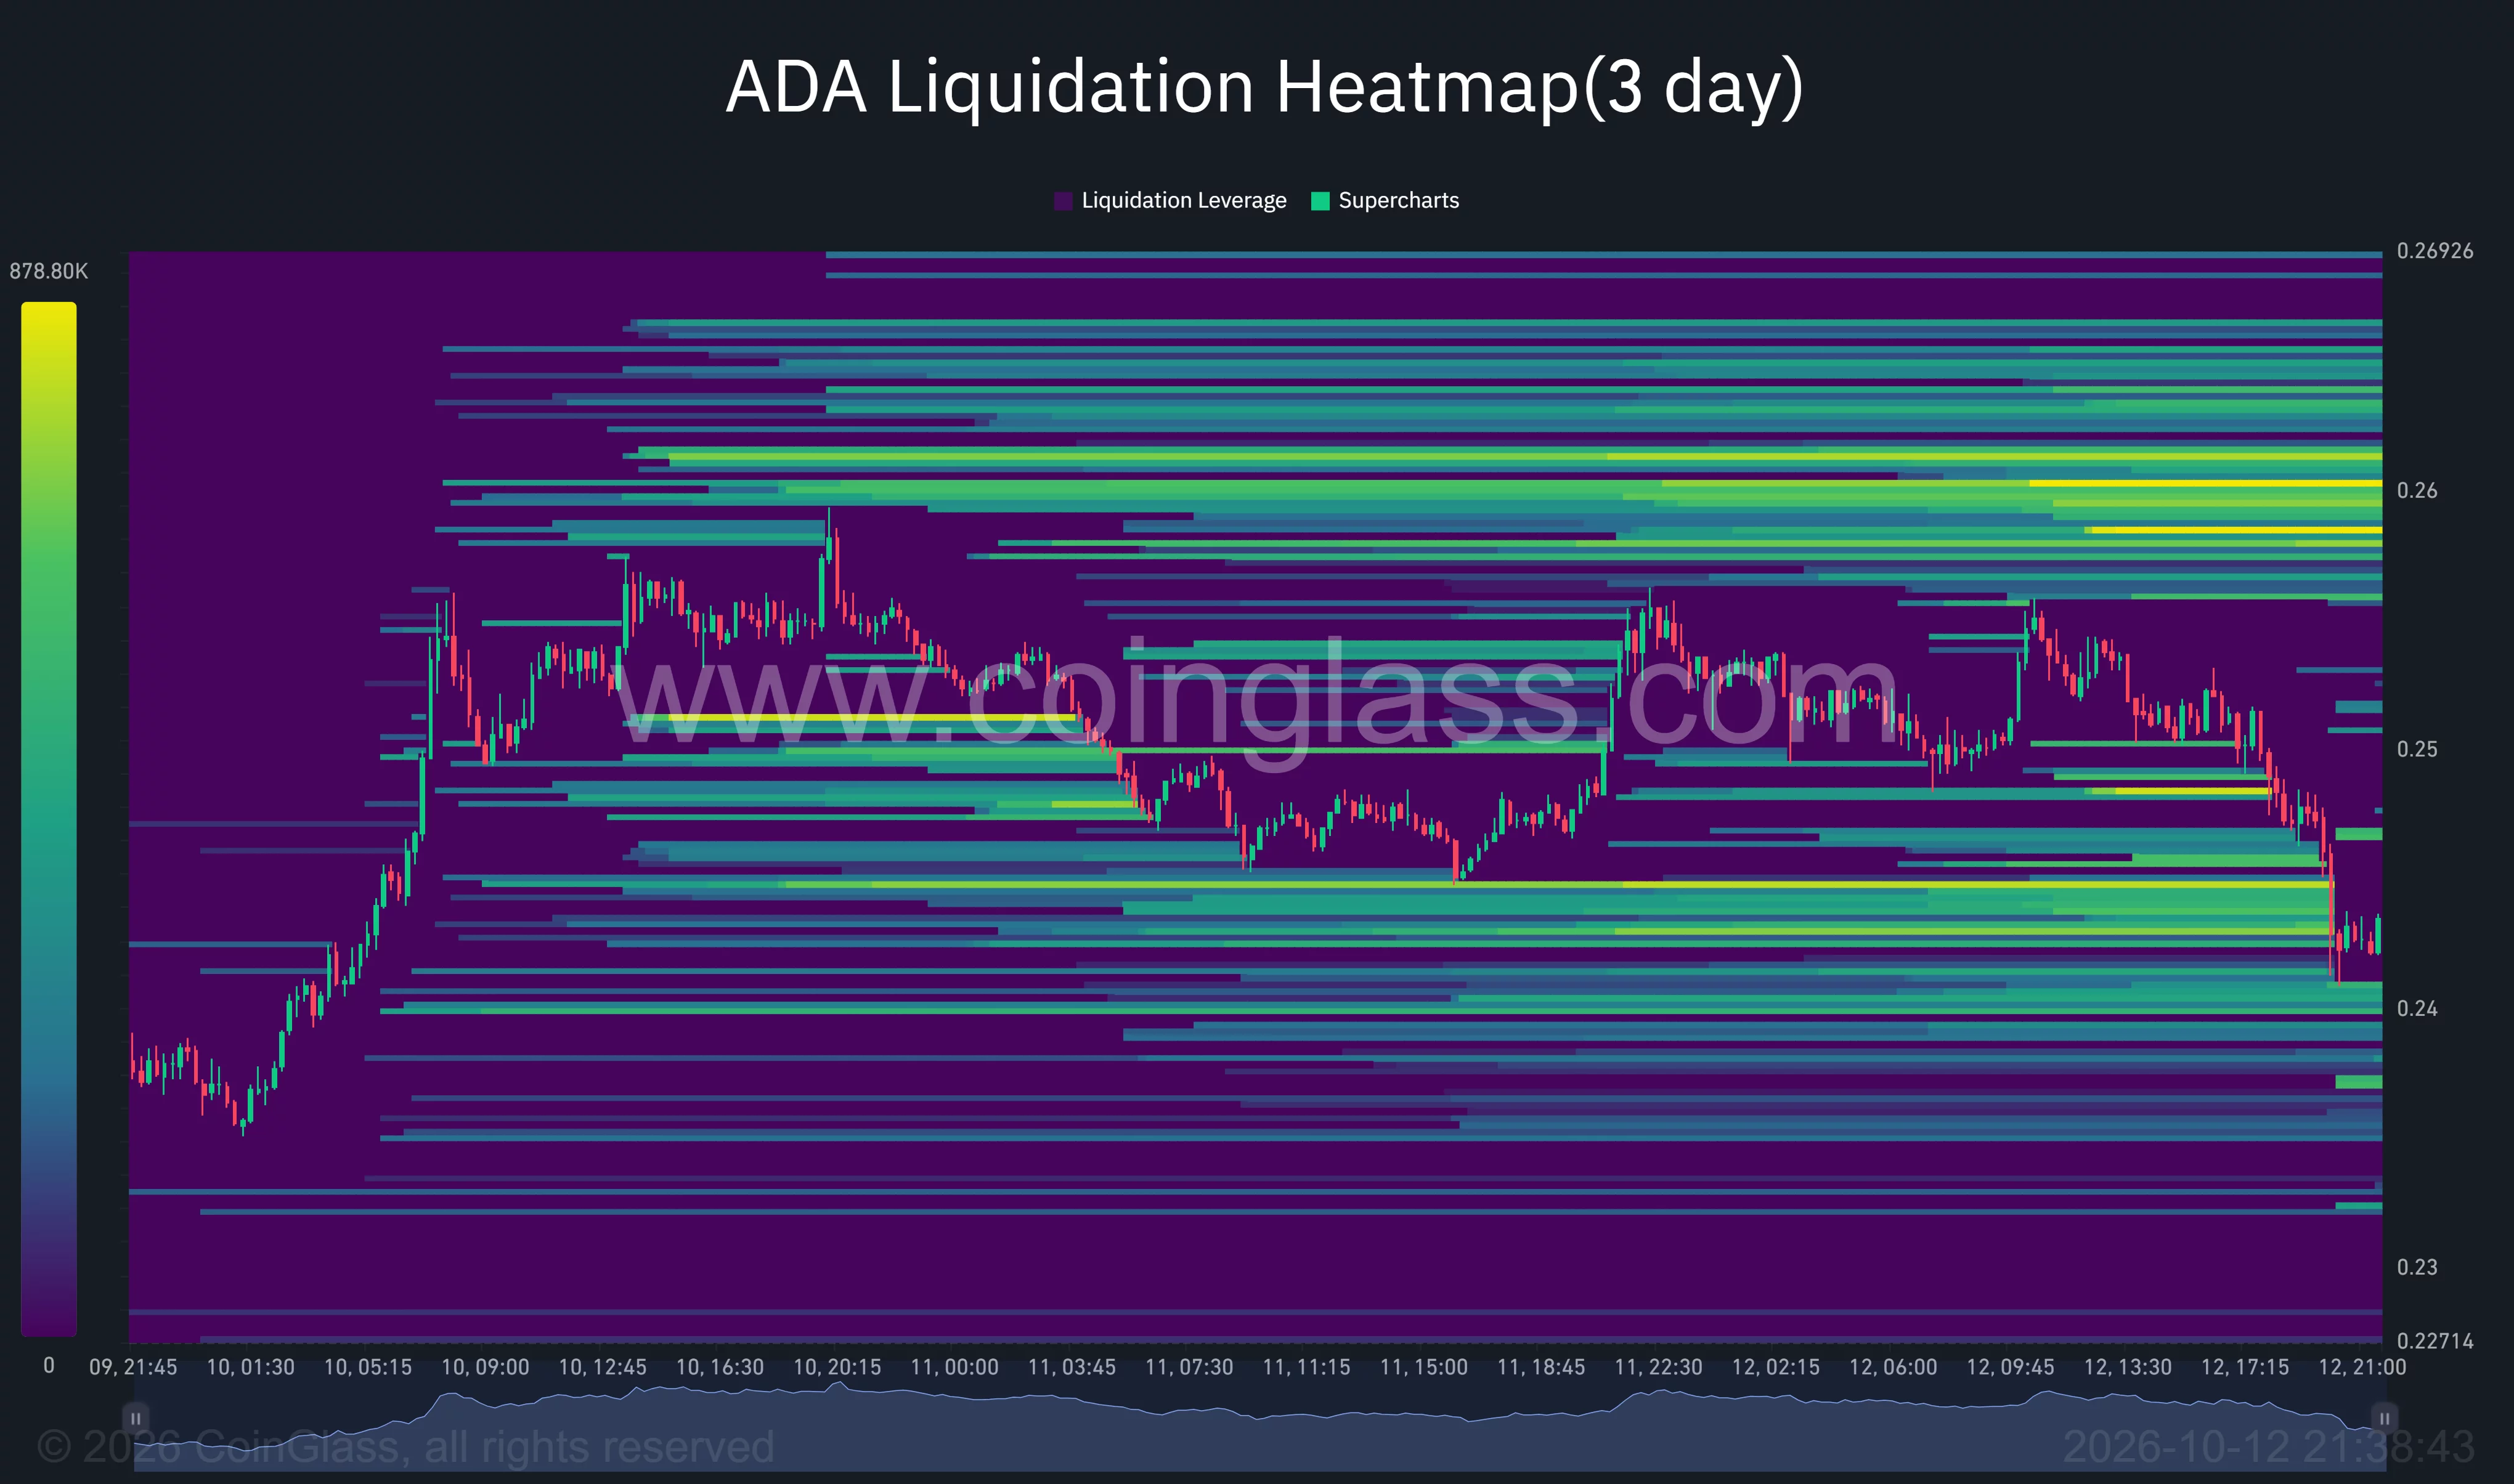
Prominent remaining overhead bands appeared around $0.258–$0.262, with additional concentrations extending toward $0.265–$0.269. Closer bands were visible around $0.244–$0.245, while lower concentrations appeared near $0.240–$0.242.
The heatmap maps estimated liquidation exposure rather than completed liquidations. Its bright bands do not establish that price will reach those levels or confirm a dollar amount of forced selling.
For U.S. holders following ADA’s dollar value, the Binance chart’s USDT quotation places the immediate reference points near $0.24 support and $0.25 overhead. Andreou’s analysis sets the broader recovery test at $0.224–$0.240, while his bullish breakout condition remains above $0.281.
Disclosure: This article does not represent investment advice. The content and materials featured on this page are for educational purposes only.