


Circle stock has remained under pressure ahead of the July 18 deadline for U.S. regulators to publish implementation rules for the GENIUS Act, while technical indicators continue to point to downside risks for CRCL shares.
Summary
- U.S. regulators must publish GENIUS Act implementation rules by July 18, putting Circle and stablecoin issuers in focus.
- CRCL stock remains under bearish pressure, with charts showing key support near $61.70 and downside risk toward $49.
- Coinbase shares have also weakened below $160 as investors await regulatory clarity and monitor key technical levels.
According to the GENIUS Act signed by President Donald Trump on July 18, 2025, federal agencies were given one year to prepare the regulatory framework governing stablecoin issuance, licensing, reserve management, and supervision.
That transition period expires on July 18, 2026, leaving the Federal Reserve, the U.S. Treasury, and other financial regulators with just days to release the required guidance.
The upcoming rules are important for Circle because the company issues USDC, one of the largest stablecoins by circulation. As crypto.news previously reported, any changes affecting reserve standards, licensing requirements, or issuer obligations could influence investor expectations for Circle’s business and, by extension, CRCL stock.
July 18 rules could become the next catalyst
Regulatory attention arrives as lawmakers remain divided over the second major U.S. crypto market structure bill.
Prediction market platform Kalshi currently assigns a 45% probability to the CLARITY Act becoming law. The bill has faced opposition from banks, which argue that allowing companies such as Circle and Coinbase to offer yield on stablecoin balances could encourage customers to move money out of traditional bank deposits.
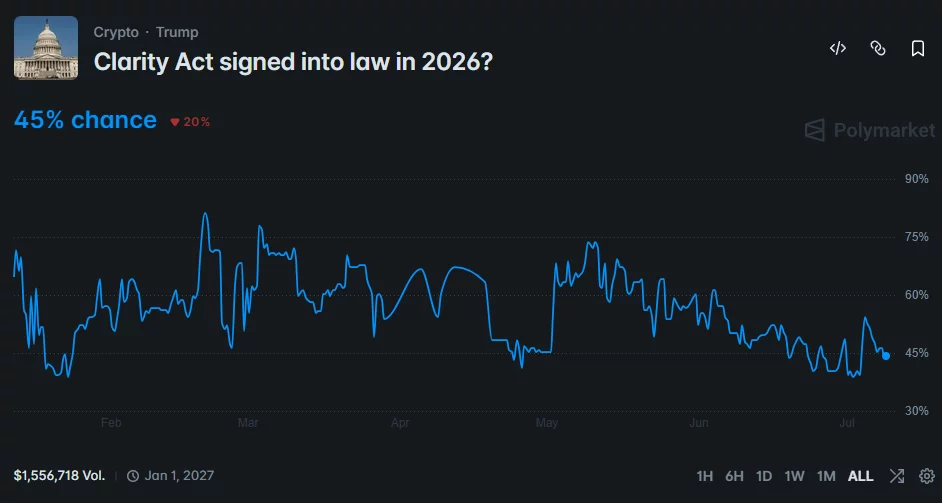
While Congress continues debating the CLARITY Act, investors are now focused on the rules tied to legislation that has already been enacted. Unlike the pending bill, the GENIUS Act requires regulators to publish detailed implementation guidelines before the statutory deadline.
Market participants will be watching whether the agencies introduce stricter capital, reserve, disclosure, or licensing standards that could affect stablecoin issuers operating in the United States.
Technical charts continue to favor sellers
CRCL shares traded around $63 on July 8 after falling 2.84% during the session as geopolitical tensions weighed on risk assets following President Trump’s statement that the Iran ceasefire had ended.
The daily chart also shows that the stock remains locked in a sustained downtrend. Price continues to trade below a descending trendline that has capped every recovery attempt since May, while the Supertrend indicator remains bearish with resistance near $82.
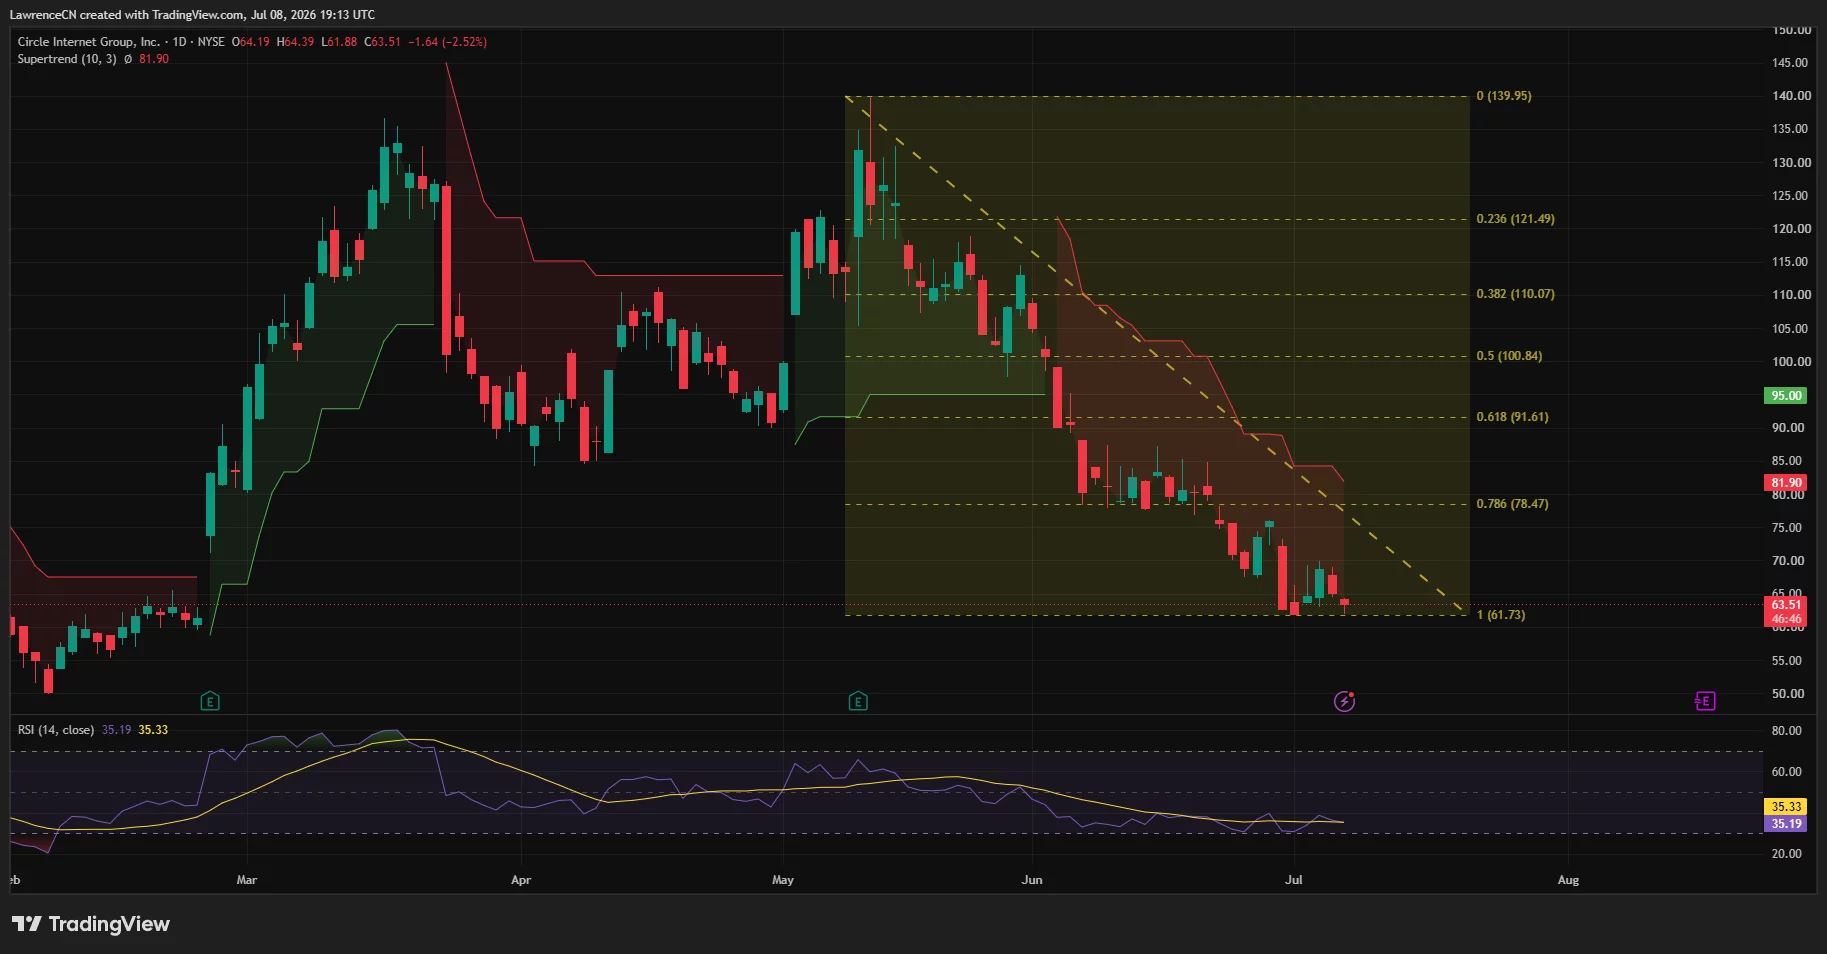
Technical support is clustered around $61.70, which coincides with the 100% Fibonacci retracement level visible on the daily chart. A confirmed break below that level through three consecutive daily closes could expose the February low near $49, extending the current decline.
Momentum indicators continue to support the bearish outlook. The Relative Strength Index has slipped to about 35, showing that sellers still control the trend even as the stock approaches oversold territory. Although an oversold reading can precede a rebound, the chart has yet to produce a confirmed reversal signal.
Coinbase shares have also weakened alongside Circle. COIN traded below the psychological $160 level after failing to clear resistance around $168, a rejection that interrupted the recovery that began at the end of June.
The Coinbase chart likewise points to continued caution. Shares remain below a descending trendline, while the Chaikin Money Flow indicator has stayed negative, suggesting capital continues to leave the stock.
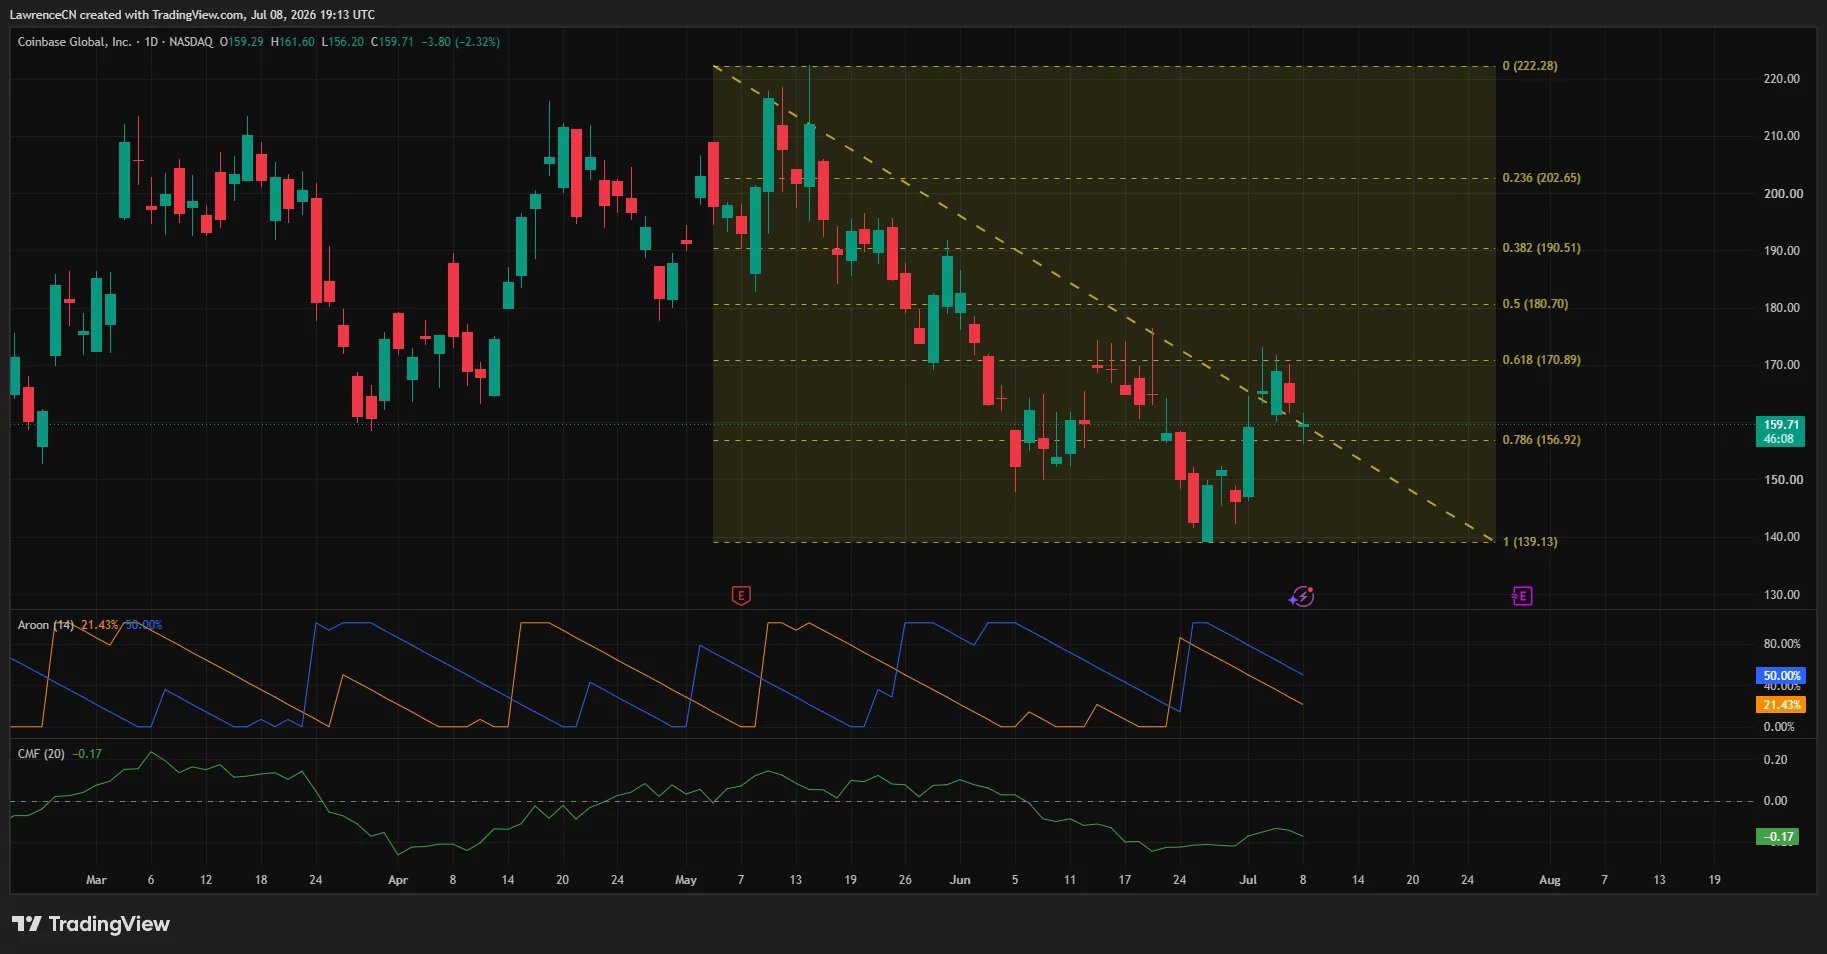
If selling pressure persists, the next support sits near $149, followed by the June 26 low around $139. A sustained move back above $168 would be needed before the technical outlook begins to improve.