


Ethereum price held above $2,700 on Oct. 1 as a wallet linked to Ethereum co founder Joseph Lubin moved 133,298 ETH, raising questions over whether the large transfer could eventually add selling pressure to the market.
Summary
- A Joseph Lubin linked wallet moved 133,298 ETH worth about $356 million to a new address, with no evidence so far that the tokens were sent to an exchange.
- ETH held above $2,700 as daily DMI and positive Chaikin Money Flow continued to show stronger buying pressure despite weakening trend strength.
- A break above $2,749 and $2,800 could put $2,900 and $3,000 in focus, while a drop below $2,636 would weaken the short term setup.
Onchain tracker Lookonchain reported that the wallet transferred 133,298 ETH, worth about $356.2 million at the time, to a new address roughly five hours before its alert.
The transaction did not send the tokens to a known centralized exchange, meaning there is currently no evidence that the ETH was moved for an immediate sale.
That distinction is important for Ethereum’s near term price outlook. Transfers to exchanges can increase the amount of ETH immediately available for trading, while movements between private wallets do not necessarily create the same selling pressure.
Still, the size of the transaction puts the receiving address in focus. Any subsequent movement of the ETH to centralized exchanges could change the market implications of the transfer.
ETH showed little immediate reaction and traded around $2,715 at press time. The token remained above the $2,700 area that has repeatedly acted as a key short term battleground during its recent recovery.
Ethereum previously fell below $2,700 after a rally toward $2,800 was rejected on Sept. 23. ETH reached an intraday high near $2,789 before falling as low as $2,648, leaving the $2,800 region as a major hurdle for buyers.
The latest resilience comes as institutional demand through U.S. spot Ethereum exchange traded funds has started to cool following a strong run of inflows.
The funds attracted nearly $690 million over five consecutive sessions through Sept. 25, providing a source of demand while ETH attempted to recover. As crypto.news previously reported, BlackRock’s ETHA accounted for $326.2 million of those weekly inflows, while Fidelity’s FETH attracted $174.1 million.
ETF demand had helped offset some of the uncertainty around ETH’s inability to sustain a move above $2,800. A separate crypto.news analysis of Ethereum’s price setup identified the $2,781 to $2,800 region as the immediate upside test, with $3,000 becoming a potential next target if buyers could establish a sustained breakout.
Staking demand has provided another source of supply absorption. Around 43.5 million ETH was staked as of Sept. 28, equal to about 35.66% of supply, while roughly 1.61 million ETH was waiting to enter staking compared with about 161,000 ETH waiting to exit.
The imbalance meant the validator entry queue was nearly 10 times larger than the exit queue when crypto.news examined Ethereum’s staking activity. Staked ETH is removed from immediately liquid supply while committed to the network, although staking demand alone does not determine future price direction.
Can Ethereum price break above $2,750?
Ethereum’s daily chart remains constructive despite the uncertainty created by the large wallet movement.
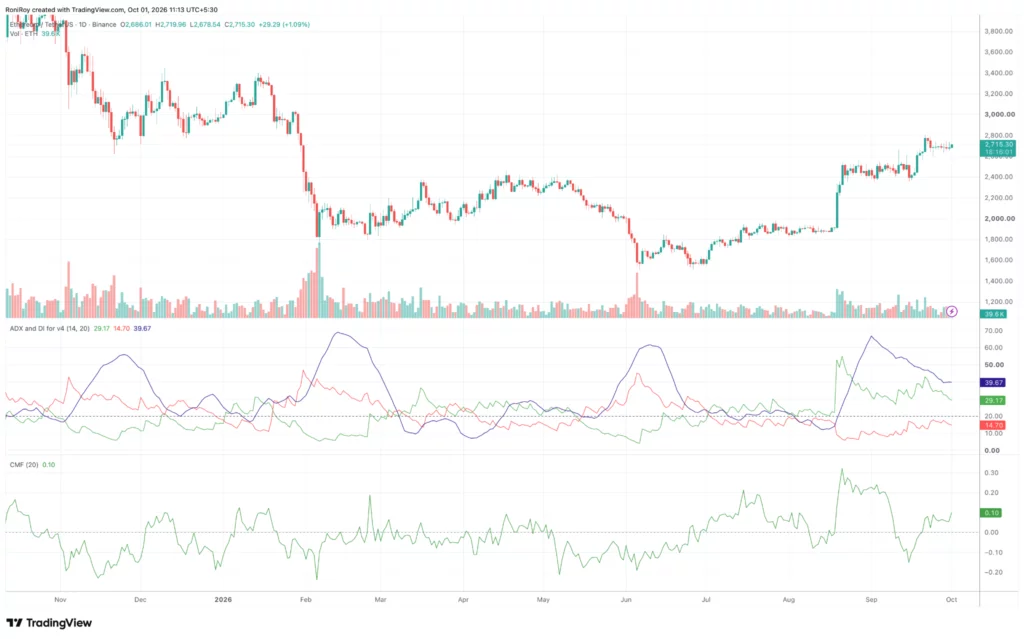
The Directional Movement Index shows the positive directional indicator at 29.17, well above the negative directional indicator at 14.70.
ADX stands at 39.67, above the 25 level commonly used to identify a meaningful directional trend. Buyers therefore continue to hold the directional advantage.
However, ADX has declined from its September peak. The drop suggests that the prevailing trend remains relatively strong but has been losing strength rather than accelerating.
Capital flows provide another positive signal.
The 20 day Chaikin Money Flow stands at 0.10 after recovering into positive territory following a brief move below zero in September.
A positive CMF indicates that buying pressure remains stronger on a volume weighted basis. More importantly for the latest whale movement, the indicator is not currently showing sustained distribution despite the transfer of 133,298 ETH.
Meanwhile on the 4-hour chart, Ethereum is trading inside its 20 period Donchian Channel, with the upper boundary at $2,748.60. The midpoint stands at $2,692.15, while the lower boundary sits at $2,635.69.
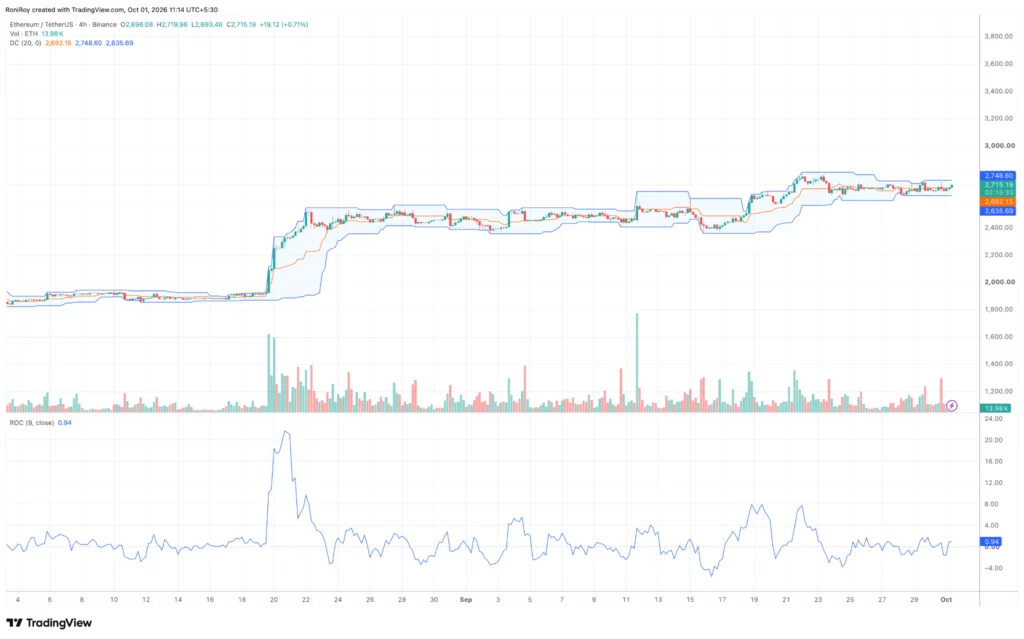
Price is therefore trading in the upper half of the channel but has yet to confirm a breakout.
The nine period Rate of Change stands at 0.94, placing short term momentum in positive territory. However, the reading remains modest and has yet to show the acceleration that would provide stronger confirmation of a breakout.
A four hour close above approximately $2,749, accompanied by an expansion in ROC, could put the recent $2,800 resistance area back in focus.
Ethereum has already struggled around that level several times. The previous rejection near $2,800 pushed ETH as low as $2,648 before buyers regained control.
A sustained break above $2,800 could open the path toward $2,900 before the psychological $3,000 level. The latter has already emerged as an important target in recent Ethereum price analysis, although ETH would first need to overcome the resistance that has repeatedly capped the recovery.
Failure to break the upper Donchian boundary would keep $2,692 in focus as the first support.
The more important short term floor sits around $2,636, near the lower boundary of the channel and close to the levels buyers defended during Ethereum’s Sept. 23 pullback.
A break below $2,636 alongside ROC moving further into negative territory would weaken the short term structure. Further confirmation would come if daily CMF dropped below zero and the negative directional indicator began closing its current gap with +DI.
For now, Ethereum’s technical structure has not shown clear evidence that the 133,298 ETH movement is translating into selling pressure. ETH remains above $2,700, daily capital flows are positive and buyers retain the directional advantage, while $2,749 to $2,800 remains the key barrier before $2,900 and $3,000 come into play.