

Ethereum price crashed below the important support at $3,000, continuing a trend that started in August when it soared to a record high of $4,965.
Summary
- Ethereum price has formed a bearish flag pattern on the weekly chart.
- The coin remains below the Supertrend indicator.
- It will likely drop to $2,500 and then bounce back later this year.
Ethereum (ETH) token dropped to a low of $2,970, down by 40% from its all-time high. This retreat occurred as the cryptocurrency and stock markets pulled back amid geopolitical risks.
Ethereum dropped because of geopolitical and Japan risks
In a statement at the World Economic Forum in Davos, President Donald Trump insisted that only the U.S. can protect Greenland. He also called for talks on how the U.S. can take over the semi-autonomous state.
His statement came a few days after he threatened to impose tariffs on eight NATO allies because of the Greenland issue.
Ethereum has also dropped amid rising Japanese bond yields, which have reached their highest levels in decades. These bond yields have jumped amid rising odds that the Bank of Japan will deliver more rate hikes this year.
Still, on the positive side, Ethereum is seeing strong demand, especially from BitMine, which has bought over 4 million coins since mid last year. Its staking ratio has jumped to 30%, while the network’s transactions and active users have soared.
Spot Ethereum ETFs have also had substantial inflows this year, bringing the cumulative total to over $12 billion. All this has driven the supply of ETH tokens on exchanges to the lowest level in years.
Ethereum has also become the largest player in real-world asset tokenization, with a market share of over 60%. It is being used by some of the biggest companies globally, like JPMorgan and Janus Henderson.
Ethereum price could crash before bouncing back

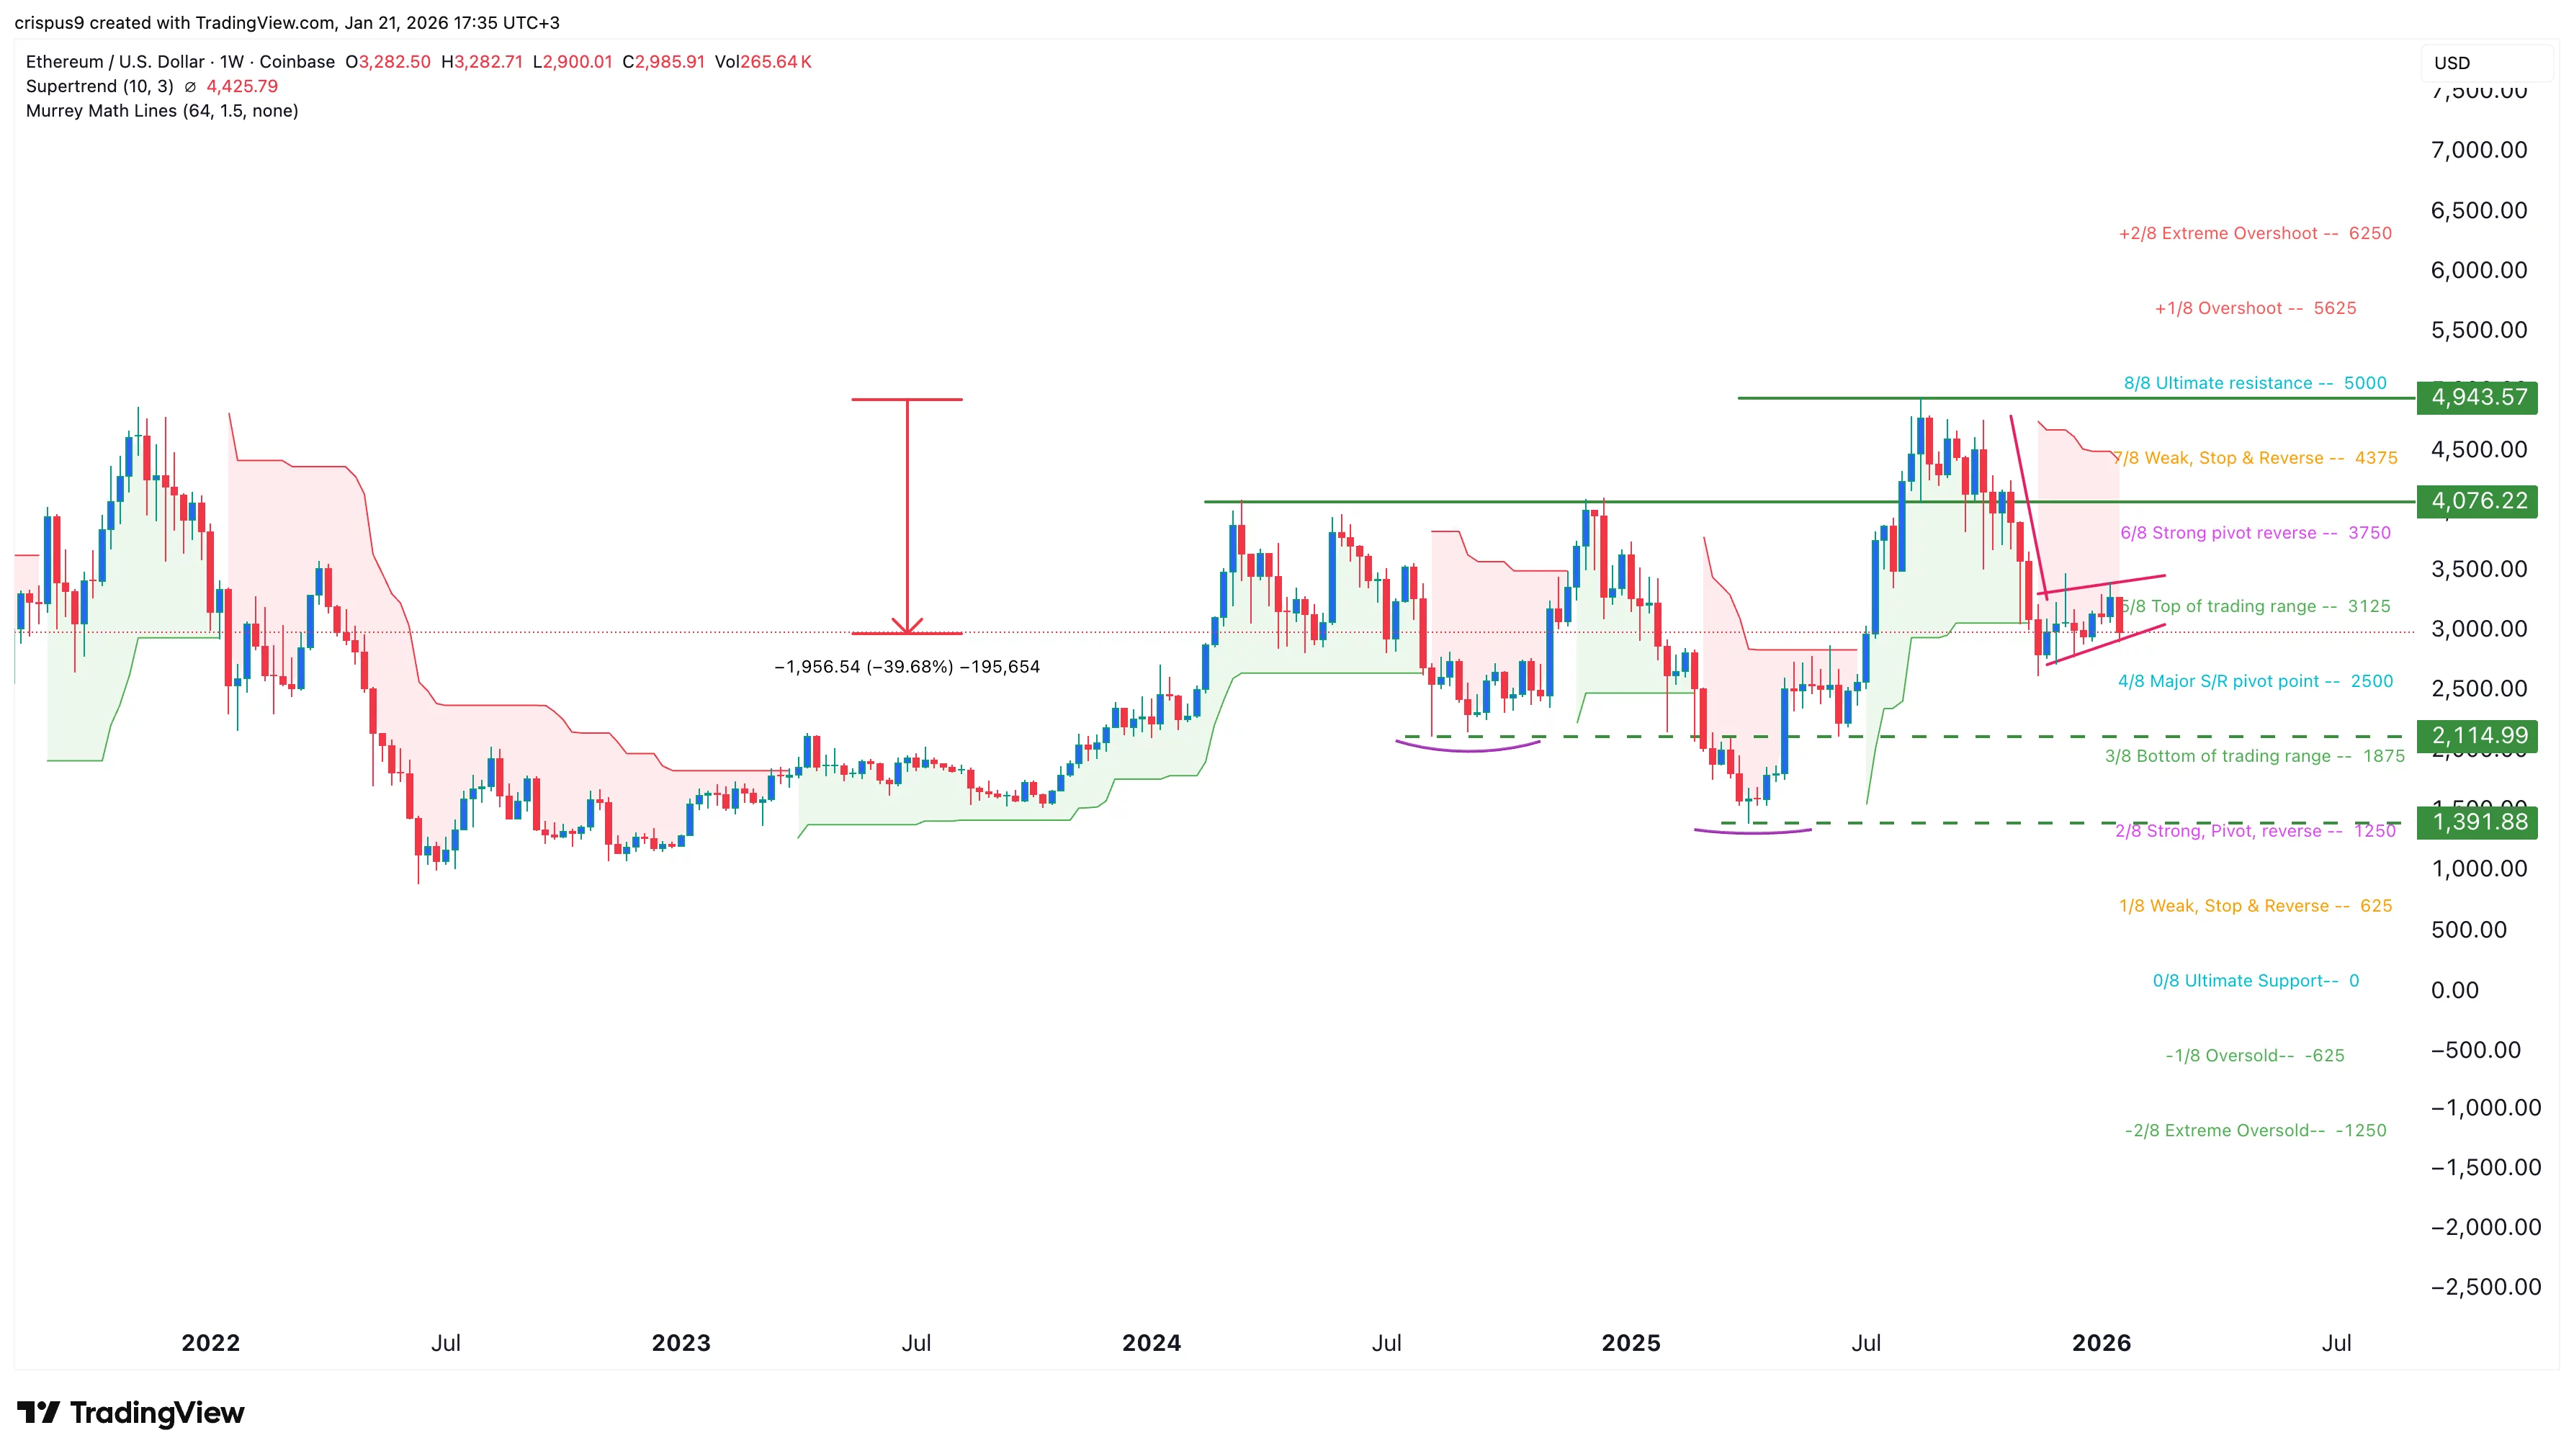
The weekly timeframe chart suggests the ETH price may be at risk of further downside in the near term. It has fallen below the Supertrend indicator, a common bearish signal.
The coin is also forming a bearish flag pattern, which consists of a vertical line and an ascending channel. Therefore, the Supertrend and the bearish flag pattern points to a drop to $2,500, which coincides with the Major S&R pivot point of the Murrey Math Lines tool.
Technically, this decline will happen as the coin completes the formation of the right shoulder of the inverted head-and-shoulders pattern. Inverted H&S is one of the most common bullish reversal patterns in technical analysis.


