


Ethereum traded below the $2,000 level as on-chain activity weakened and short-term technical indicators stayed under pressure.
Summary
- Ethereum exchange withdrawals fell to 16.05 million ETH, their lowest level since June 2024.
- Failed transactions and exchange inflows have increased slightly as ETH trades below $2,000 support.
- RSI near 29.69 places Ethereum close to oversold levels, but sellers still control momentum.
The move came as exchange withdrawal data dropped to its lowest level since June 2024, while failed transactions and exchange inflows showed fresh signs of network and market stress.
Ethereum withdrawals fall to June 2024 low
Data from the Ethereum Exchange Outflow 30D indicator showed that total withdrawals from exchanges fell to about 16.05 million ETH. Arab Chain said the reading marked the lowest level since June 2024.
Lower exchange withdrawals can show that fewer users are moving ETH away from trading platforms. This often points to slower long-term accumulation, especially when price action remains weak or range-bound.
Binance led Ethereum withdrawals with about 7.00 million ETH. OKX followed with around 1.43 million ETH, while Coinbase Prime ranked third with about 1.12 million ETH. Kraken, Bitget, and HTX Global recorded lower withdrawal activity.
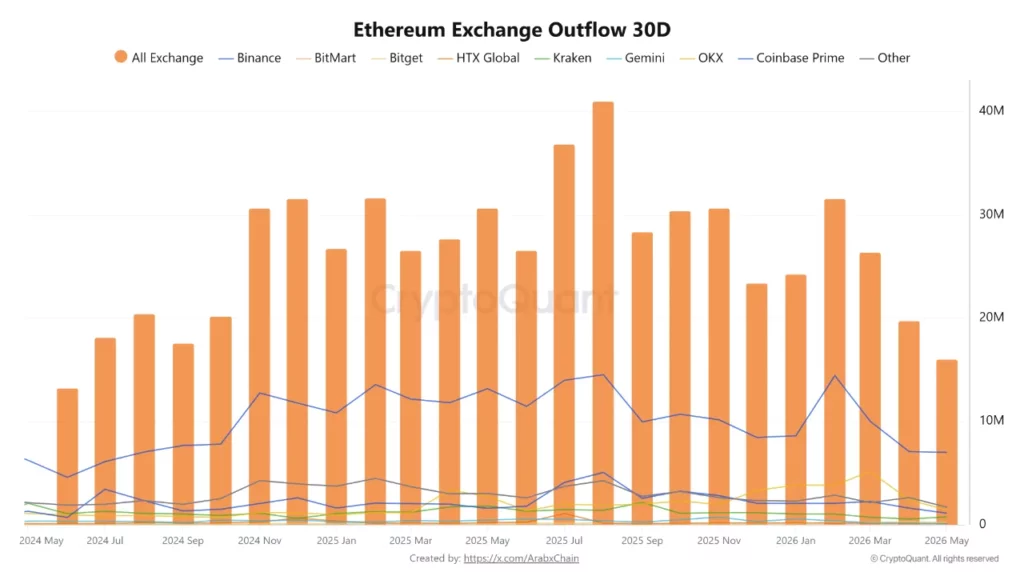
The drop does not give a direct bearish signal on its own. Still, it shows that off-exchange activity has slowed at a time when Ethereum is trying to hold key support levels.
Failed transactions and inflows add pressure
Separate on-chain data shared by nino showed that Ethereum failed transactions may be rising. The same update also pointed to a slight increase in exchange inflows.
The analyst described the failed transaction count as “may be experiencing an upward trend” and said the mix of network friction and exchange-bound liquidity “could possibly indicate a somewhat bearish outlook.”
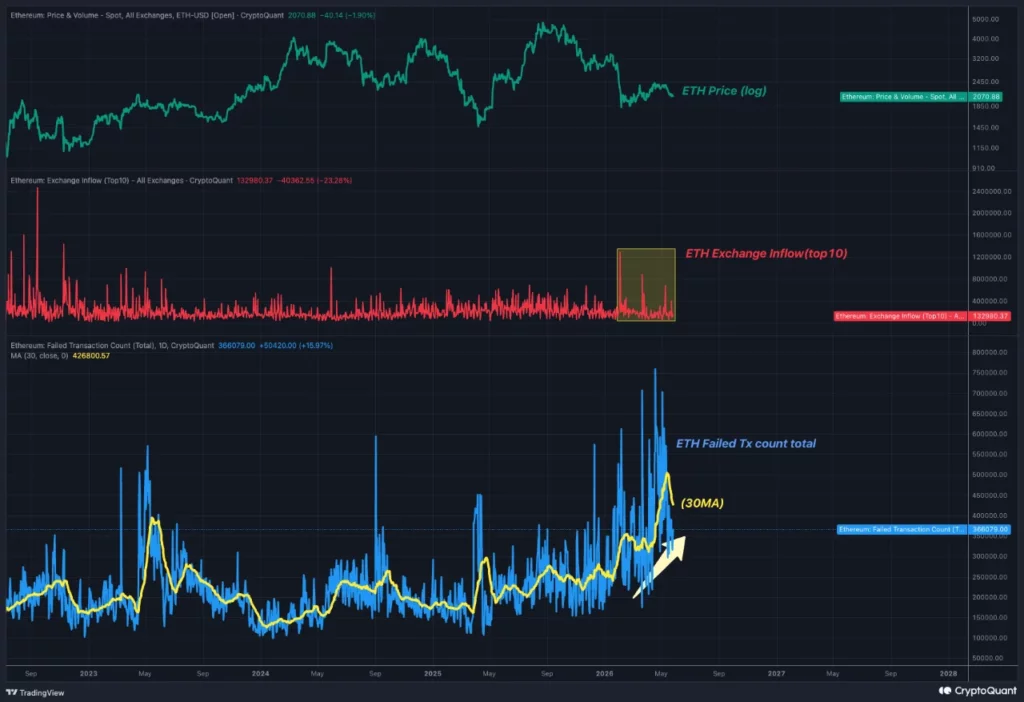
A rise in failed transactions can suggest higher network friction, user errors, or pressure around smart contract activity. It does not always mean demand is falling, but it can weaken confidence when paired with soft price action.
Exchange inflows can also carry market risk. When more ETH moves onto exchanges, traders may prepare to sell, hedge, or reposition. That does not confirm selling, but it adds caution during a weak market.
Ethereum price breaks below $2,000
Ethereum (ETH) traded near $1,986 after falling below the $2,000 mark. The move placed ETH under a key psychological level that traders often watch during market pullbacks.
As previously reported by crypto.news, the broader crypto market remained under pressure on May 28 after Bitcoin and Ethereum broke key support levels. The report said more than $900 million in leveraged crypto positions were liquidated across the derivatives market.
Ethereum also fell as the total crypto market weakened. Bitcoin dropped below $73,000, while major altcoins also posted losses as traders reduced exposure to risk assets.
Santiment said Ethereum’s drop below $2,000 triggered more “buy the dip” calls from retail traders. The firm warned that strong crowd optimism after a sharp decline can sometimes mean the market still has more downside before fear returns.
ETH technical analysis shows bearish bias
Ethereum remains below the Bollinger Band midline near $2,169. That shows short-term weakness because price has not reclaimed the central range.
ETH is also trading close to the lower Bollinger Band near $1,957. This area now acts as a key support zone. A break below it would show stronger downside pressure and could expose lower price levels.
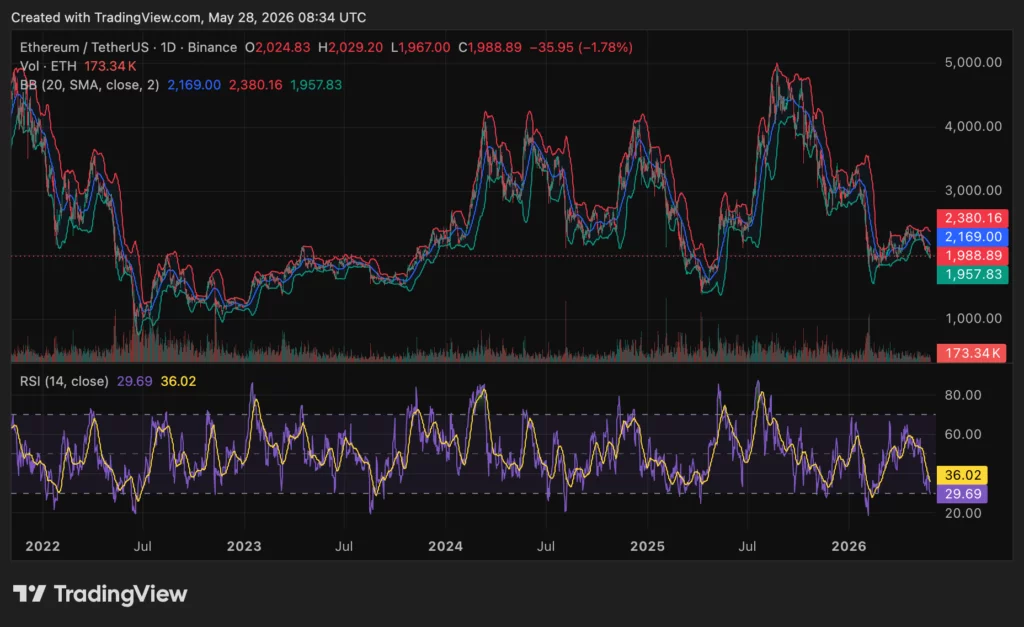
The Bollinger Bands are compressing after the recent decline. The upper band sits near $2,380, while the lower band sits near $1,957. A recovery above $2,169 would be the first clear sign that the short-term structure is improving.
The RSI stands near 29.69, below its moving average near 36.02. This confirms weak momentum and seller control. However, the low RSI also means ETH is close to oversold territory, where short-term relief bounces can form if buyers return.
For now, Ethereum’s short-term setup remains bearish. Holding the $1,950–$1,970 area is important. A drop below that range could keep sellers in control, while a move back above $2,169 would ease pressure and help rebuild recovery momentum.
Disclosure: This article does not represent investment advice. The content and materials featured on this page are for educational purposes only.