


HBAR price is holding key Fibonacci support as volume builds, signaling potential accumulation and increasing the probability of a bullish rotation toward higher resistance.
Summary
- HBAR is defending the 0.618 Fibonacci support on multiple tests
- Bullish volume is increasing, signalling growing demand
- A confirmed higher low opens upside toward $0.14 resistance
HBAR’s (HBAR) recent price action is entering a technically significant phase as the market continues to defend a major Fibonacci support level. After an extended period of consolidation, the price has repeatedly tested the same area without breaking lower, suggesting that demand is beginning to absorb selling pressure.
This behavior is important because it follows a prolonged corrective phase. When markets retest support multiple times without continuation to the downside, it often signals seller exhaustion and the early stages of a structural transition. For HBAR, this transition is becoming increasingly evident at longer time horizons.
HBAR price key technical points
- HBAR is holding the 0.618 Fibonacci retracement across multiple tests
- Daily closes above support indicate sustained demand
- A confirmed higher low could open upside toward $0.14 resistance

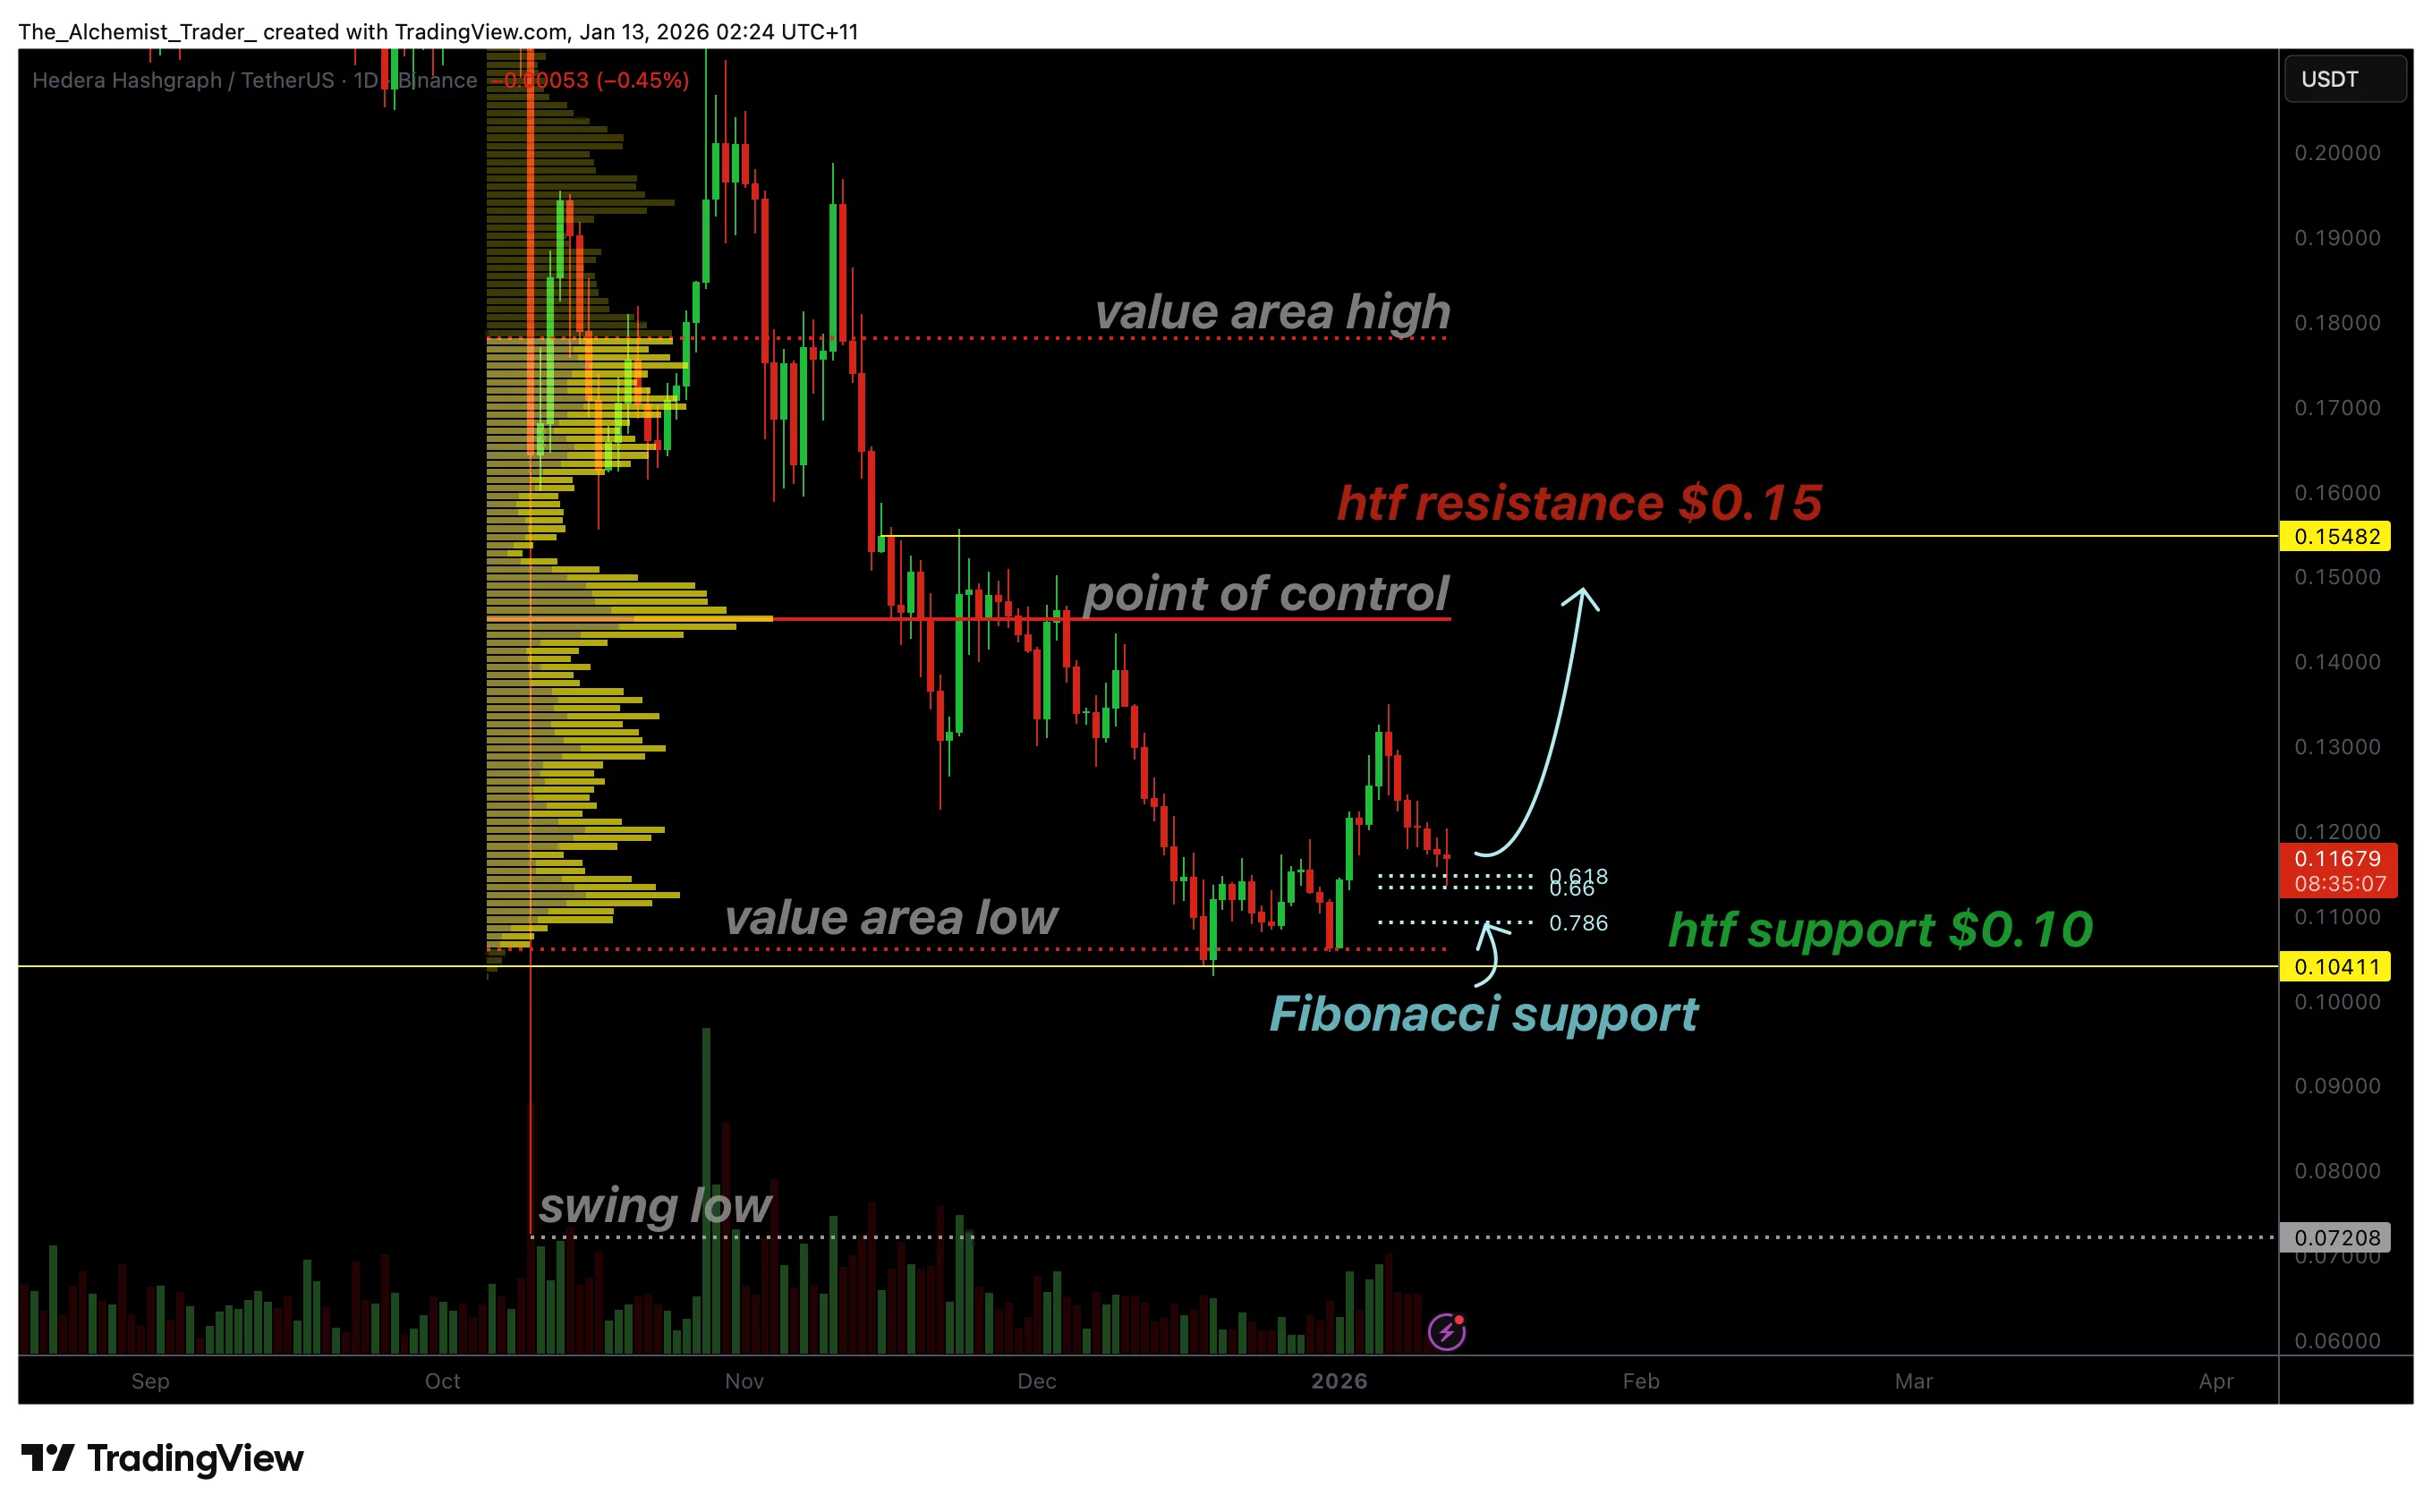
The 0.618 Fibonacci retracement is widely regarded as a critical level in technical analysis, often acting as a decision point between continuation and reversal. In HBAR’s case, price has tested this level repeatedly and continues to close above it on a daily basis.
These repeated closes are significant. Instead of sharply rejecting or accelerating lower, price has remained compressed around support for several sessions. This type of behavior typically reflects growing demand, as buyers are increasingly willing to step in at the same level.
From a market mechanics perspective, sustained acceptance at support often leads to the formation of a higher low. This higher low acts as the foundation for trend transitions, particularly when it follows a downtrend or corrective structure.
Market structure and higher-low formation
As long as HBAR continues to hold above the broader support zone around $0.10, the probability of establishing a higher low remains elevated. This level represents the base of the current structure and serves as the key invalidation point for the bullish thesis.
If price maintains acceptance above this support, a rotation toward the Point of Control becomes increasingly likely. The Point of Control represents the price level with the highest traded volume and often acts as a magnet during market rebalancing phases.
A move back toward this level would signal that value is shifting higher, reinforcing the view that accumulation is occurring rather than distribution.
Volume behavior and momentum shift
Volume plays a critical role in determining whether a reversal is developing or if price is simply consolidating before another move lower. In recent sessions, HBAR has begun to show increasing bullish volume while holding Fibonacci support, which is a constructive signal from a momentum perspective.
Rising volume at support suggests that buyers are becoming more active and confident, helping absorb sell-side pressure. This behavior often precedes expansion phases, especially when it occurs alongside higher-low formation.
If volume continues to build during subsequent upward rotations, it would further validate the bullish structure and increase confidence in a continuation toward higher resistance.
Upside resistance and structural confirmation
The next major area of interest is the $0.14 high-time-frame resistance. This level represents a significant structural barrier and serves as the primary upside target if the bullish scenario continues to develop.
A rotation into this zone would establish a higher high, which, when combined with a higher low at Fibonacci support—would confirm a full market structure shift. This transition from lower highs and lower lows to higher highs and higher lows is the defining characteristic of bullish trend initiation.
Such a shift would signal that the corrective phase has ended and that HBAR has entered a new accumulation-to-expansion cycle.
What to expect in the coming price action
In the near term, HBAR is likely to continue consolidating above Fibonacci support as the market completes a higher-low formation. As long as the price remains above $0.10 and continues to hold the 0.618 retracement level, downside risk remains limited.
A sustained rotation toward the Point of Control would indicate improving structure, while continued volume expansion would strengthen the case for a move toward $0.14.
From a technical, price-action, and market-structure perspective, HBAR is positioned at a critical inflection point. The defense of Fibonacci support combined with rising volume suggests a bullish reversal is developing, increasing the probability of a rotation toward high-time-frame resistance and confirmation of a broader structural shift.


