


Hyperliquid has rebounded toward $93 after its late-September pullback, putting HYPE within reach of $93.75 resistance as traders watch whether a flag breakout can extend the recovery toward $100 in October.
Summary
- Hyperliquid price traded near $93.07 on the daily chart, with the session up 2.81%.
- Daily Chaikin Money Flow reached 0.20, while the weekly Supertrend remained below price.
- CoinGlass showed a bright liquidation cluster near $95, with additional bands approaching $100.
- Analyst Sjuul identified a flag breakout and raised the prospect of another record high.
TradingView’s Oct. 5 daily HYPE/USDT chart showed a price of $93.072, with a session high of $93.751 and a low of $90.023. The recovery has brought the token back above the $87.50 pivot marked by the chart’s Murrey Math indicator.
HYPE’s latest advance follows a volatile September. CoinGlass’s month-long price overlay shows a decline toward $75–$76 around mid-month, followed by a rally toward $98 and another retreat into the mid-$80s before the October rebound.
The daily and weekly charts now place HYPE near the upper end of that recent range. A move through nearby resistance would strengthen the case for another test of September’s peak, while rejection would leave the recovery vulnerable to another support test.
Hyperliquid faces its first October test at $93.75
The daily Murrey Math indicator places the nearest resistance at $93.75, almost exactly matching the session high. HYPE traded slightly below that level at the chart’s recorded price of $93.072.
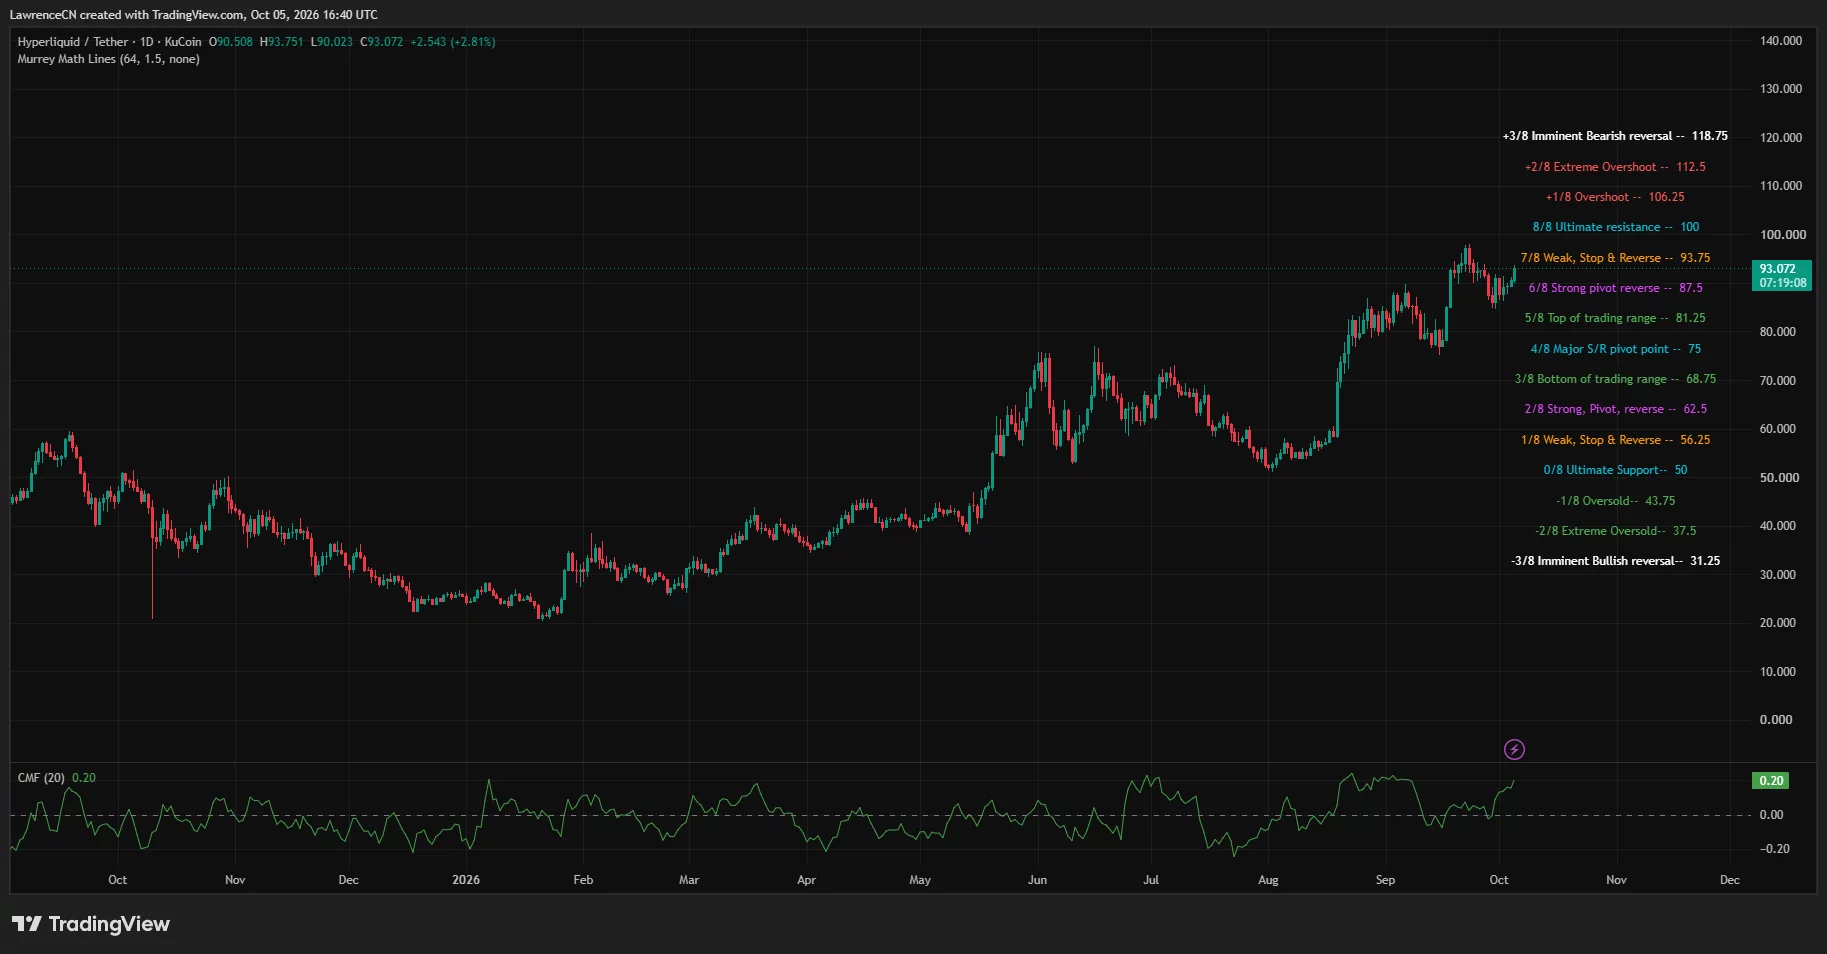
A sustained move above $93.75 would put the recent peak around $98 back in focus. The next marked Murrey Math resistance stands at $100, approximately 7.4% above the recorded daily price.
Beyond $100, the indicator marks extension levels at $106.25 and $112.50. Both are conditional upside reference points for a breakout scenario; HYPE would first need to clear the nearby resistance and September high.
The daily Chaikin Money Flow reading stood at 0.20. A positive reading indicates that the indicator’s combination of price and volume favors accumulation over its lookback period, supporting the recovery visible in the candles.
However, price still needs to break through the upper boundary of its recent trading range. Positive money flow alongside a rejection at $93.75 would leave the chart with improving buying pressure but an unresolved resistance test.
On the downside, $87.50 is the first major Murrey Math pivot below price. A retreat to that level would represent a decline of roughly 6% from $93.072.
The next marked levels sit at $81.25 and $75. The latter is close to the September trough visible on the liquidation heatmap, making it a deeper downside reference if the recent recovery breaks down.
Weekly indicators keep the broader uptrend intact
The weekly TradingView chart showed HYPE at $92.984, with the Supertrend line at $61.464. Price remained above the green trend line following the rally from its early-2026 lows.
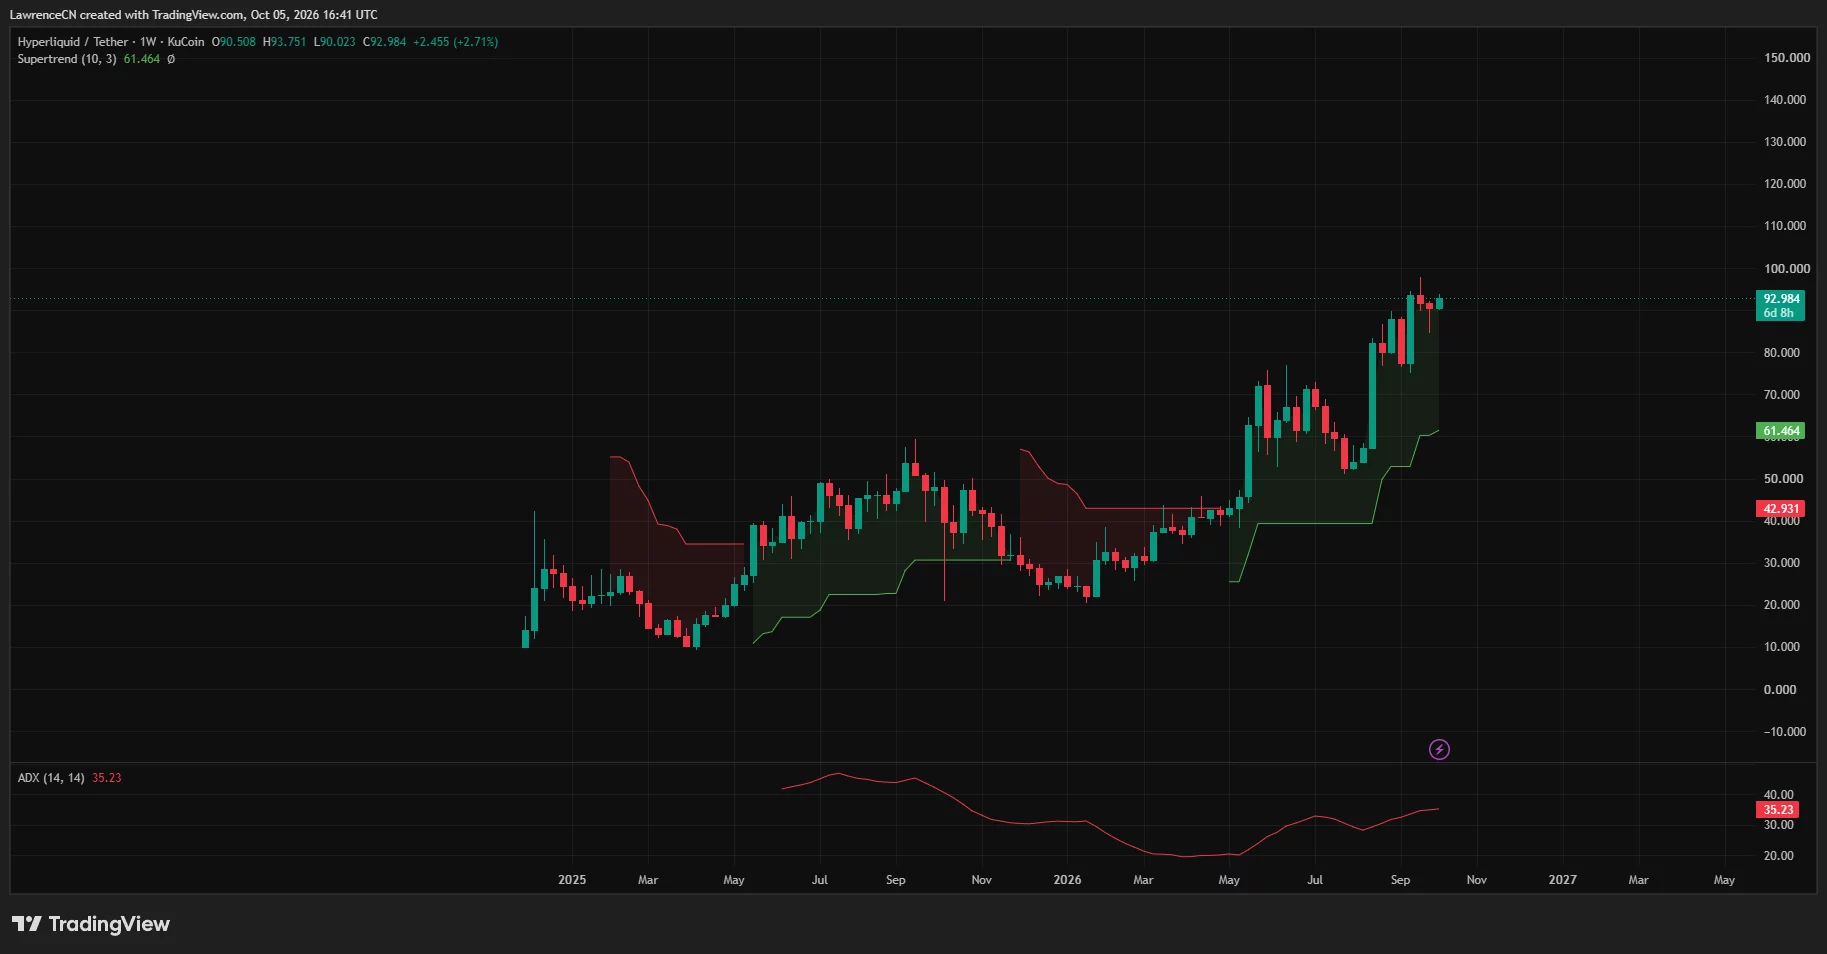
Weekly candles also show HYPE trading above the June and July peaks around the mid-$70s. The late-September correction therefore left price above a previous area of resistance on the broader chart.
Weekly Average Directional Index reached 35.23, rising from readings closer to 20 earlier in the year. ADX measures trend strength, while the green Supertrend and price structure provide the directional context.
Together, the readings support a stronger weekly trend even as HYPE approaches resistance on the daily timeframe. The gap between price and the weekly Supertrend also leaves room for a sizable pullback without an immediate change in that indicator.
For October’s nearer-term outlook, the daily levels remain more relevant. A loss of $87.50 would weaken the latest rebound before price came close to testing the much lower weekly Supertrend.
Liquidation concentrations put $95 in focus
CoinGlass’s one-month liquidation heatmap showed a bright cluster near $95 at the right edge of the chart. Additional concentrations appeared around $96–$97 and $99–$100.
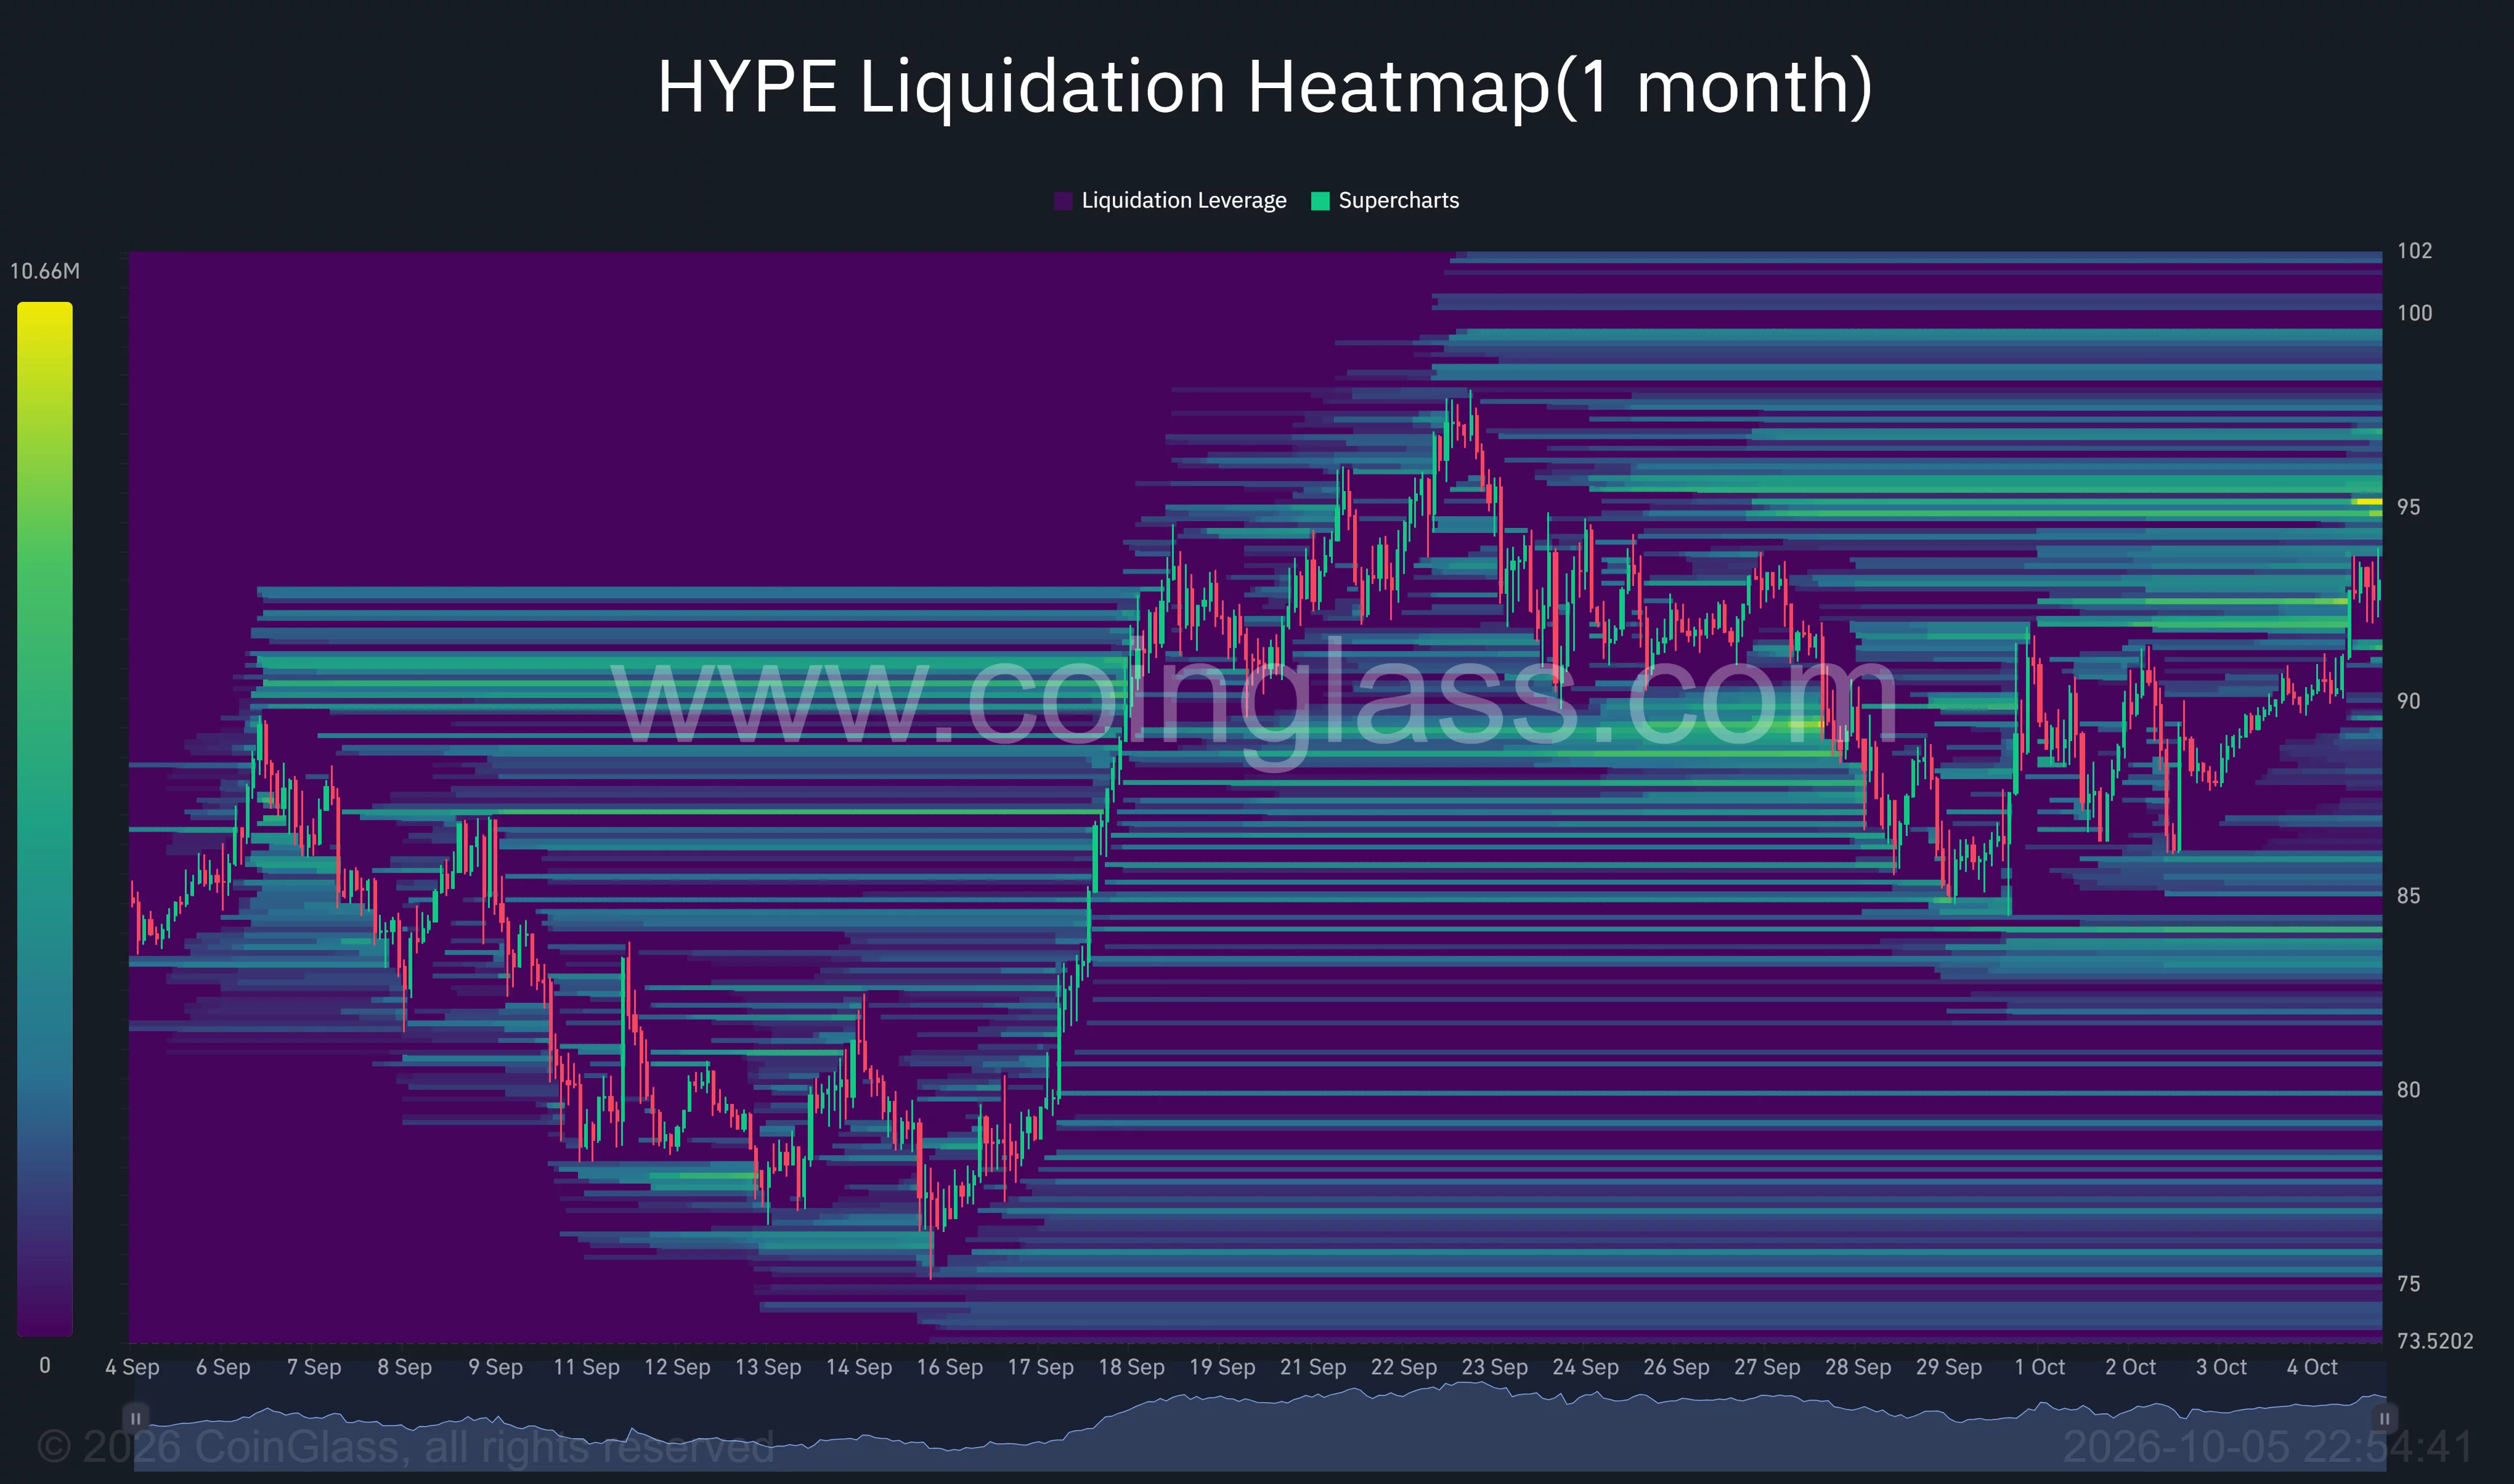
The $95 band sits between the daily resistance at $93.75 and September’s peak near $98. If HYPE continues higher, that area becomes an immediate zone to watch for volatility involving leveraged positions.
Below price, visible liquidation bands sit around $90–$92, $89, and the mid-$80s. A pullback through the nearest bands could bring the $87.50 daily pivot back into focus.
The overlap near $100 is another notable feature: the daily indicator marks resistance there, while the heatmap shows liquidation concentrations nearby. A rally into that zone would bring HYPE toward both a round-number barrier and an area of leveraged exposure.
Analysts favor further upside, with $87.50 guarding the recovery
In an Oct. 5 post, analyst Sjuul said HYPE was breaking out of a flag and compared the formation with an earlier accumulation pattern.
“Fresh all-time high incoming?”
His accompanying chart showed price moving above a descending resistance line beneath the previous peak. The bullish interpretation depends on HYPE holding that breakout and extending the advance through nearby overhead resistance.
A separate Oct. 5 post attributed to Guy described HYPE as approaching another stage of a longer-term parabolic move. The chart used widening yellow boundaries around the weekly advance, rather than a specific October price target.
For U.S. investors, access remains a separate consideration. A Bitwise prospectus filed with the SEC states that Hyperliquid’s website interface excludes restricted persons, including people and entities located in the United States.
Hyperliquid’s fee documentation also states that fees flow to community mechanisms, including the assistance fund, and that HYPE in the fund is burned.
The chart-based bullish October scenario requires HYPE to hold above $87.50 and establish support above $93.75, opening a path toward $95, the September peak, and $100. A rejection followed by a break below $87.50 would instead shift attention toward $81.25, with $75 marking the next deeper support.
Disclosure: This article does not represent investment advice. The content and materials featured on this page are for educational purposes only.