

Since the panicked sell-off at the beginning of this week, where major cryptocurrencies saw massive declines, including Bitcoin (BTC) that slid from $91,000 to $85,000 in a few hours, today, the broader crypto market has stabilized and bounced back.
During the early trading hours today,
.cwp-coin-chart svg path {
stroke-width: 0.65 !important;
}
.cwp-coin-widget-container .cwp-graph-container.positive svg path:nth-of-type(2) {
stroke: #008868 !important;
}
.cwp-coin-widget-container .cwp-coin-trend.positive {
color: #008868 !important;
background-color: transparent !important;
}
.cwp-coin-widget-container .cwp-coin-popup-holder .cwp-coin-trend.positive {
border: 1px solid #008868;
border-radius: 3px;
}
.cwp-coin-widget-container .cwp-coin-trend.positive::before {
border-bottom: 4px solid #008868 !important;
}
.cwp-coin-widget-container .cwp-coin-price-holder .cwp-coin-trend-holder .cwp-trend {
background-color: transparent !important;
}
.cwp-coin-widget-container .cwp-graph-container.negative svg path:nth-of-type(2) {
stroke: #A90C0C !important;
}
.cwp-coin-widget-container .cwp-coin-popup-holder .cwp-coin-trend.negative {
border: 1px solid #A90C0C;
border-radius: 3px;
}
.cwp-coin-widget-container .cwp-coin-trend.negative {
color: #A90C0C !important;
background-color: transparent !important;
}
.cwp-coin-widget-container .cwp-coin-trend.negative::before {
border-top: 4px solid #A90C0C !important;
}
![]()
Bitcoin

1.13%
![]()
Bitcoin
BTC
Price
$91,533.20
1.13% /24h
Volume in 24h
$38.42B
<!–
?
–>
Price 7d
// Make SVG responsive
jQuery(document).ready(function($) {
var svg = $(‘.cwp-graph-container svg’).last();
if (svg.length) {
var originalWidth = svg.attr(‘width’) || ‘160’;
var originalHeight = svg.attr(‘height’) || ’40’;
if (!svg.attr(‘viewBox’)) {
svg.attr(‘viewBox’, ‘0 0 ‘ + originalWidth + ‘ ‘ + originalHeight);
}
svg.removeAttr(‘width’).removeAttr(‘height’);
svg.css({‘width’: ‘100%’, ‘height’: ‘100%’});
svg.attr(‘preserveAspectRatio’, ‘xMidYMid meet’);
}
});
hovered near $92,000 from where it has come down and is currently trading at
. It failed to push towards $93,000 overnight, continuing its choppy and directionless movement as it has done in the last several sessions.
Sellers have defended the $93,000 level since mid-November, and the buyers have stepped in at $91,000. Neither side is winning, hence BTC’s continued sideways movement.
Bitcoin has 2 decent liquidity clusters right now.
The upside liquidity is around the $94,500 level, while the downside liquidity is around the $90,000 level.
IMO, a sweep of downside liquidity before reversal makes sense. pic.twitter.com/nFR9Tvvqt4
— Ted (@TedPillows) December 5, 2025
Moreover, BTC’s one-month chart shows that it is still trapped in a descending structure stemming from its earlier November highs. The latest rebound printed another lower high. Its price peaked near $93,500 before rolling over, keeping the broader corrective pattern intact.
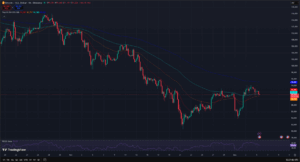

(Source: TradingView)
At the same time, momentum is weak and intraday recovery attempts fade quickly, highlighting that liquidity is still thin at the current level. A clean breach of the $91,000 level will lead to more downslides, testing support at $90,000-$90,500.
To reverse the price action, bulls must recover and maintain above the $93,200. This will invalidate the short-term downtrend.
Meanwhile, liquidation data reveals that traders have lost nearly $45 million in longs and $50 million in shorts over the last 24 hours. Plus, macro data is adding more pressure on the broader crypto market.
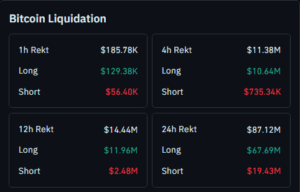

(Source: CoinGlass)
The US ADP (Automatic Data Processing) Payroll fell by 32000 in November, missing expectations, resulting in a cooling labour market. The futures market has assigned a 90% Fed rate cut probability for December this year.
EXPLORE: Next 1000X Crypto – Here’s 10+ Crypto Tokens That Can Hit 1000x This Year
Crypto Today: ETH Retests $3,200
.cwp-coin-chart svg path {
stroke-width: 0.65 !important;
}
.cwp-coin-widget-container .cwp-graph-container.positive svg path:nth-of-type(2) {
stroke: #008868 !important;
}
.cwp-coin-widget-container .cwp-coin-trend.positive {
color: #008868 !important;
background-color: transparent !important;
}
.cwp-coin-widget-container .cwp-coin-popup-holder .cwp-coin-trend.positive {
border: 1px solid #008868;
border-radius: 3px;
}
.cwp-coin-widget-container .cwp-coin-trend.positive::before {
border-bottom: 4px solid #008868 !important;
}
.cwp-coin-widget-container .cwp-coin-price-holder .cwp-coin-trend-holder .cwp-trend {
background-color: transparent !important;
}
.cwp-coin-widget-container .cwp-graph-container.negative svg path:nth-of-type(2) {
stroke: #A90C0C !important;
}
.cwp-coin-widget-container .cwp-coin-popup-holder .cwp-coin-trend.negative {
border: 1px solid #A90C0C;
border-radius: 3px;
}
.cwp-coin-widget-container .cwp-coin-trend.negative {
color: #A90C0C !important;
background-color: transparent !important;
}
.cwp-coin-widget-container .cwp-coin-trend.negative::before {
border-top: 4px solid #A90C0C !important;
}
![]()
Ethereum
0.89%
![]()
Ethereum
ETH
Price
$3,138.10
0.89% /24h
Volume in 24h
$20.90B
<!–
?
–>
Price 7d
// Make SVG responsive
jQuery(document).ready(function($) {
var svg = $(‘.cwp-graph-container svg’).last();
if (svg.length) {
var originalWidth = svg.attr(‘width’) || ‘160’;
var originalHeight = svg.attr(‘height’) || ’40’;
if (!svg.attr(‘viewBox’)) {
svg.attr(‘viewBox’, ‘0 0 ‘ + originalWidth + ‘ ‘ + originalHeight);
}
svg.removeAttr(‘width’).removeAttr(‘height’);
svg.css({‘width’: ‘100%’, ‘height’: ‘100%’});
svg.attr(‘preserveAspectRatio’, ‘xMidYMid meet’);
}
});
has had a strong day. It jumped 5% in the last 24 hours to trade around $3,184, from where it has come down slightly to its current position at
.
The rally came right after the Fusaka upgrade went live on 3 December, boosting the block gas limit from 45 million to 150 million. A lot of mumbo jumbo for what essentially translates to a smoother activity for apps and users, and the network gaining the ability to handle more transactions at once.
Meanwhile, on-chain data shows that ETH’s daily transactions have climbed past 1.8 million due to heavy use from DeFi, NFTs, and Layer 2 projects.
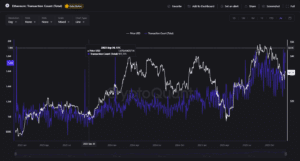

(Source: CryptoQuant)
X sleuth, Mags pointed out that ETH’s current price action looks a lot like the setup from the 2021 bull run. Then, BTC/ETH had bottomed out, bounced back, and retested support before ripping higher.
Mags noted that ETH is sitting on the same kind of support zone at the moment, which previously has sparked a 170% rally in just seven weeks. If history repeats itself, ETH could be around 0.092 BTC, or roughly $8,500.
#Ethereum against BTC bottomed exactly at the same level as previous cycle.
Right now, it’s around the exact support from where it pumped 170% in just 7 weeks, printing seven weekly green candles in a row, followed by a slow distribution phase.
You know what's coming . pic.twitter.com/5oNpRXLJAL
— Mags (@thescalpingpro) December 5, 2025
Right now, ETH is trading at
, which is still under its 50-day moving average at $3,424 and 200-day moving average at $3,534, with the trend remaining slightly bearish.
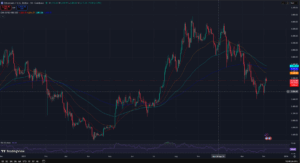

Source: (TradingView)
Breaching of the key support at $2,740–$2,750 will result in further downslides.
EXPLORE: The 12+ Hottest Crypto Presales to Buy Right Now
There are no live updates available yet. Please check back soon!
The post [LIVE]Crypto Update Today: BTC And ETH Move Sideways, Can They Hold? appeared first on 99Bitcoins.


