


Solana price has broken below the $100 level for the first time in ten months, putting the market’s focus squarely on whether the next layer of support can hold.
Summary
- Solana fell to $98, its lowest price since April 2025, extending a sharp multi-week downtrend.
- Weak volume, falling open interest, and oversold indicators suggest capitulation rather than aggressive shorting.
- Technical structure remains bearish unless bulls reclaim $100 and short-term moving averages.
As selling pressure continues to build throughout the crypto market, Solana has fallen below $100, bringing the token to its lowest level in about ten months. SOL was trading at $98.03 at press time, down 6.3% in the past day.
Since early April 2025, when Solana (SOL) briefly fell below $100 before rising, this is the first sustained decline below that level. The current decline looks more severe. SOL is down nearly 20% over the last week and roughly 25% over the last 30 days.
As prices decline, market activity also decreased. Solana’s 24-hour trading volume fell 26% to $7.63 billion, suggesting that the weekend sell-off may be easing. Derivatives reflect the same trend
According to CoinGlass data, total volume has dropped 21% to $19.26 billion, while open interest is down 5% at $6.15 billion, suggesting long positions are being unwound rather than new shorts aggressively entering.
Macro pressure weighs on sentiment despite strong fundamentals
The broader crypto market has been under pressure. Over the weekend, a wave of liquidations swept through the market as heavily leveraged positions were forced out, amplified by thin liquidity.
At the same time, expectations of tighter U.S. monetary policy resurfaced after President Trump nominated former Federal Reserve governor Kevin Warsh as the next Fed chair, a pick widely seen as hawkish.
Geopolitical concerns have added to the risk-off mood. Reports of rising U.S.–Iran tensions have pushed investors toward safer assets, with crypto once again losing ground amid the uncertainty.
That said, Solana’s network data continues to show strength. crypto.news reported on Feb. 1 that the network processed over 2.34 billion transactions in January, a 33% increase, and more than Ethereum, Base, and BNB Chain combined.
While Bitcoin and Ethereum products saw net outflows in January, U.S. spot Solana exchange-traded funds recorded $104 million in inflows, indicating that interest from traditional investors has also risen.
Solana price technical analysis
Solana’s daily chart remains bearish. A major psychological and structural level has been broken, as confirmed by the decline below $100, which strengthens the current downward trend.
SOL continues to record lower highs and lower lows and is trading well below its declining 20-day and 50-day moving averages. The fact that recent attempts to rise have stalled close to the mid-Bollinger Band indicates that sellers maintain control even in small rallies.
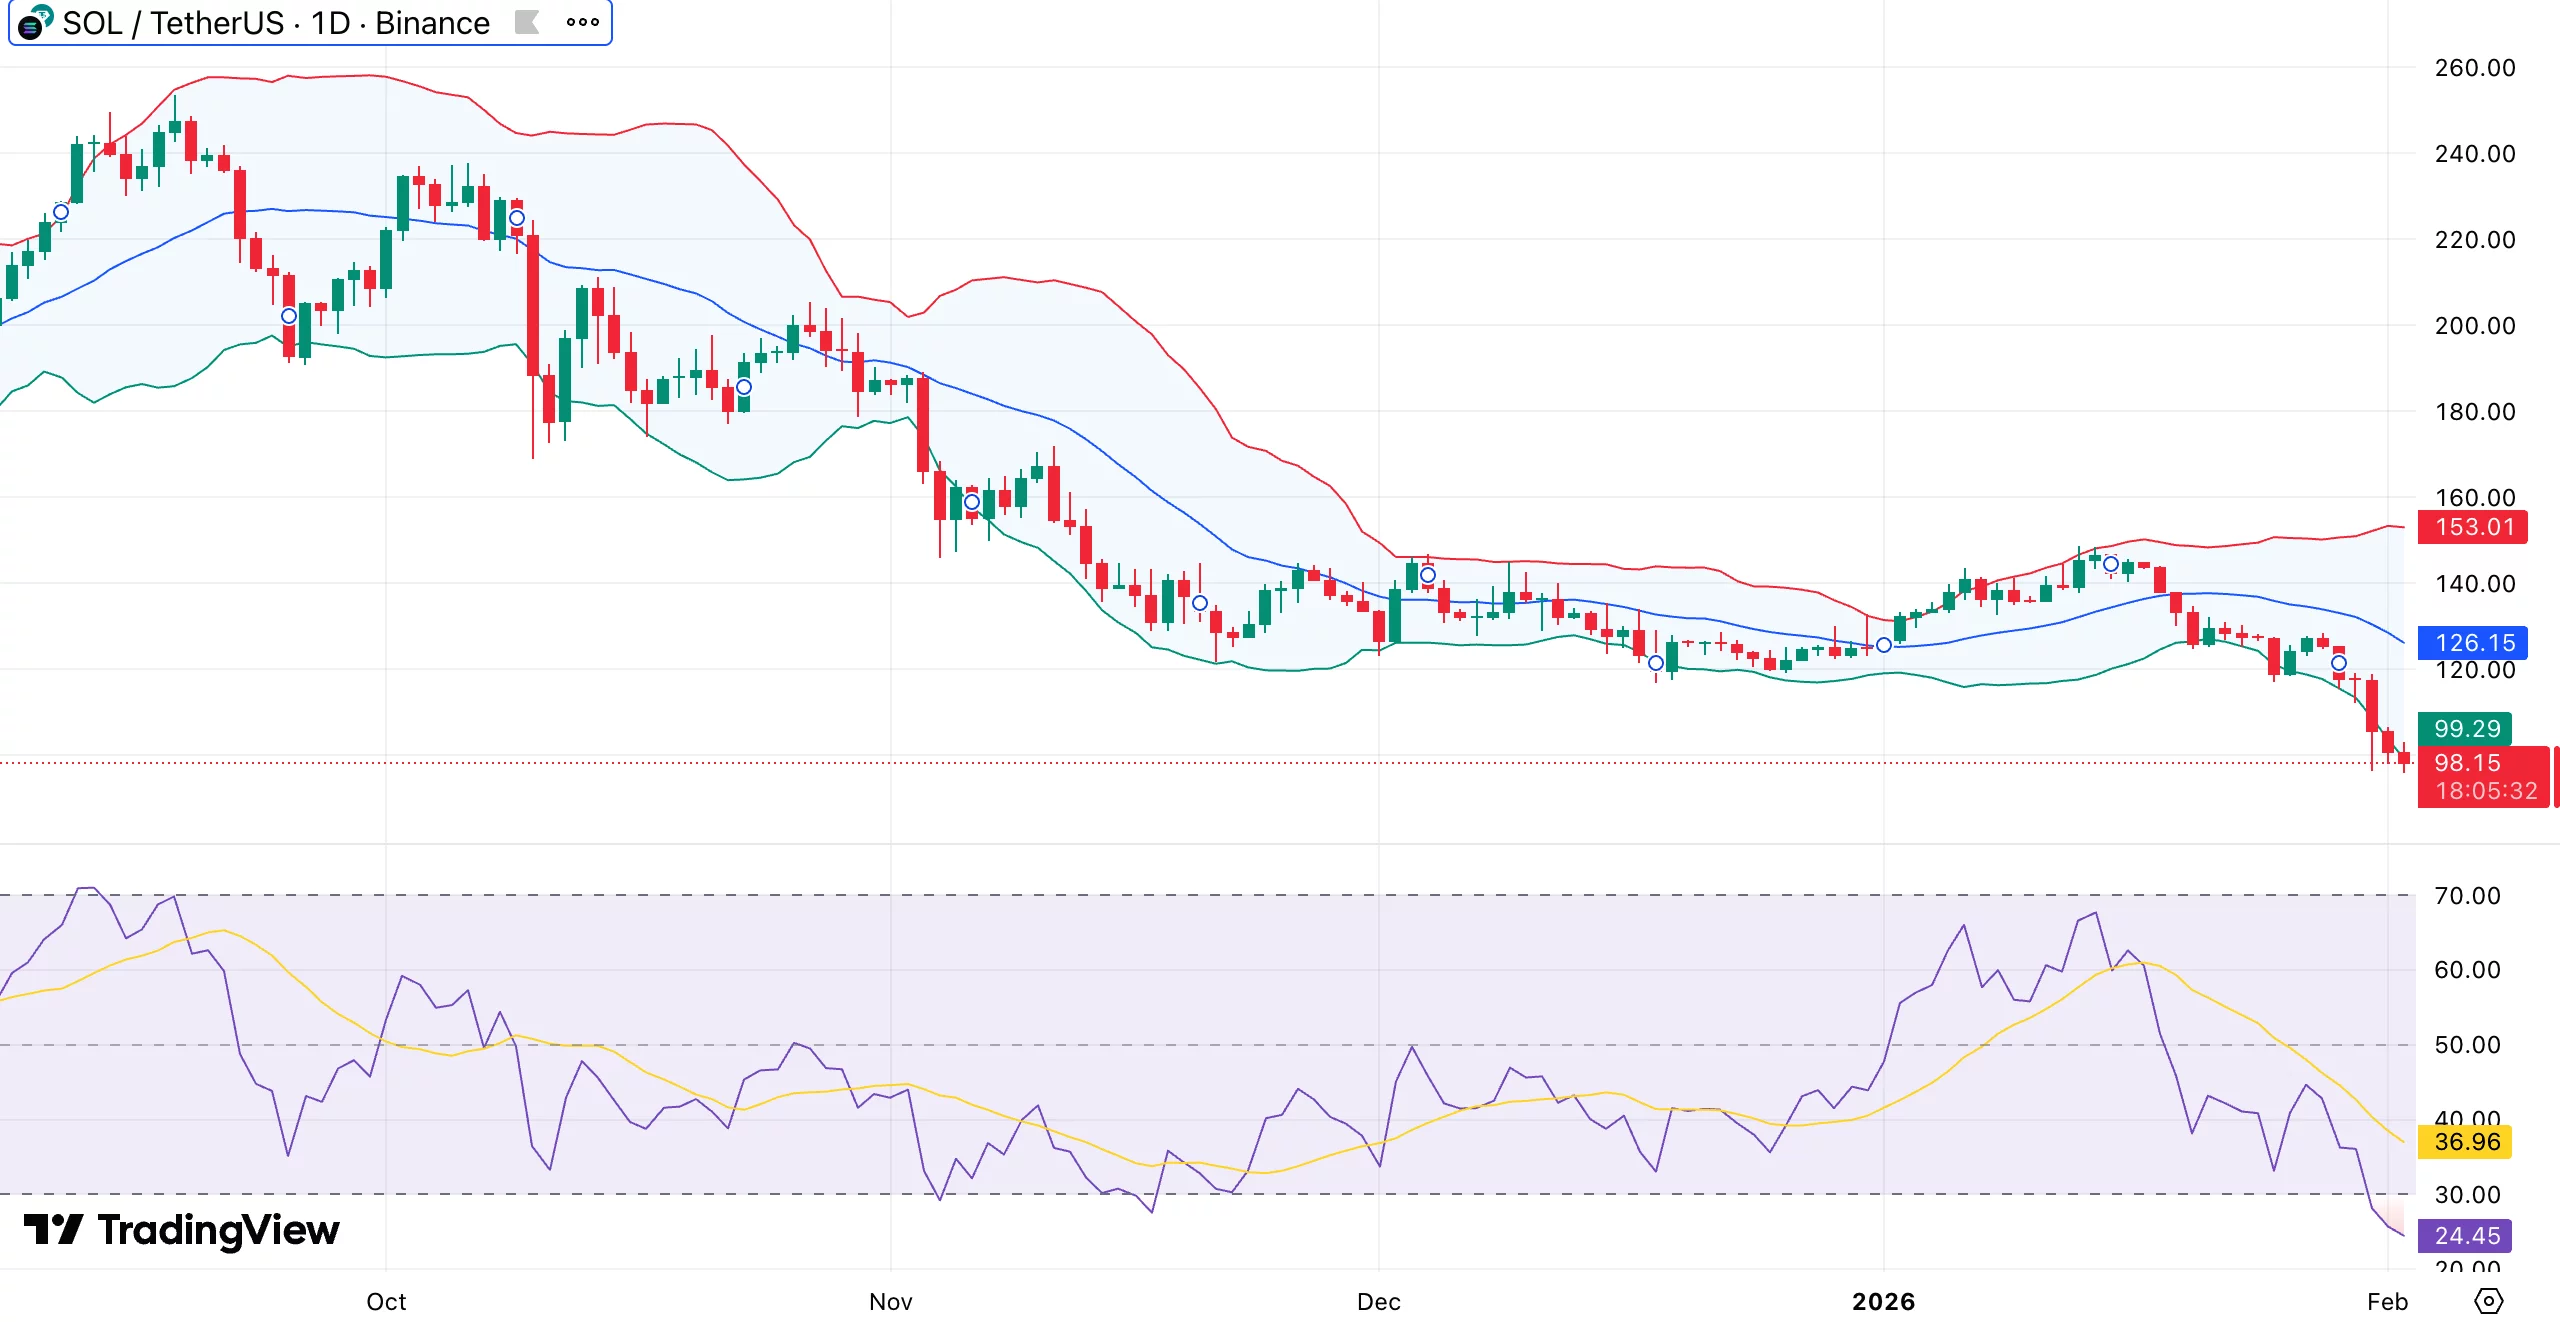
The Bollinger Bands are widening, with the price hugging the lower band, suggesting that downward momentum is gaining strength rather than stabilizing. Momentum indicators are also stretched.
The daily relative strength index has fallen to around 25, placing SOL deep in oversold territory. While this raises the chance of a short-term bounce, it does not, by itself, signal a trend reversal.
On the downside, the next area to watch sits around $92–90, followed by $85, which previously acted as a consolidation zone. $80 stands out as a higher macro support level if selling pressure persists.
Solana would have to recover $100 and stay above short-term moving averages for bulls to take back control. Until then, any upward movements will probably be seen as corrective within a bearish structure that is still dominant.


