


Solana price has rejected a key resistance zone near $90, signaling the potential continuation of an ABC corrective structure.
Summary
- Key Resistance: $90 aligns with high-timeframe resistance and the value area high.
- ABC Correction: Rejection suggests the C-leg of a corrective structure may be underway.
- Support to Watch: A break below $81 could open downside toward the value area low.
Solana’s (SOL) recent price action suggests the market may be entering a corrective phase following a clear rejection from the upper boundary of its trading range. The $90 region has acted as a significant high-timeframe resistance zone, aligning with the value area high and several structural resistance levels on the chart.
With the latest move failing to hold above this region, the probability of a deeper corrective move is beginning to increase.
Solana price key technical points
- Range-High Resistance: $90 aligns with high-timeframe structural resistance and the value area high.
- ABC Structure: Price action is signaling the continuation of a corrective ABC pattern.
- Downside Target: Potential move toward $81 support and the value area low.

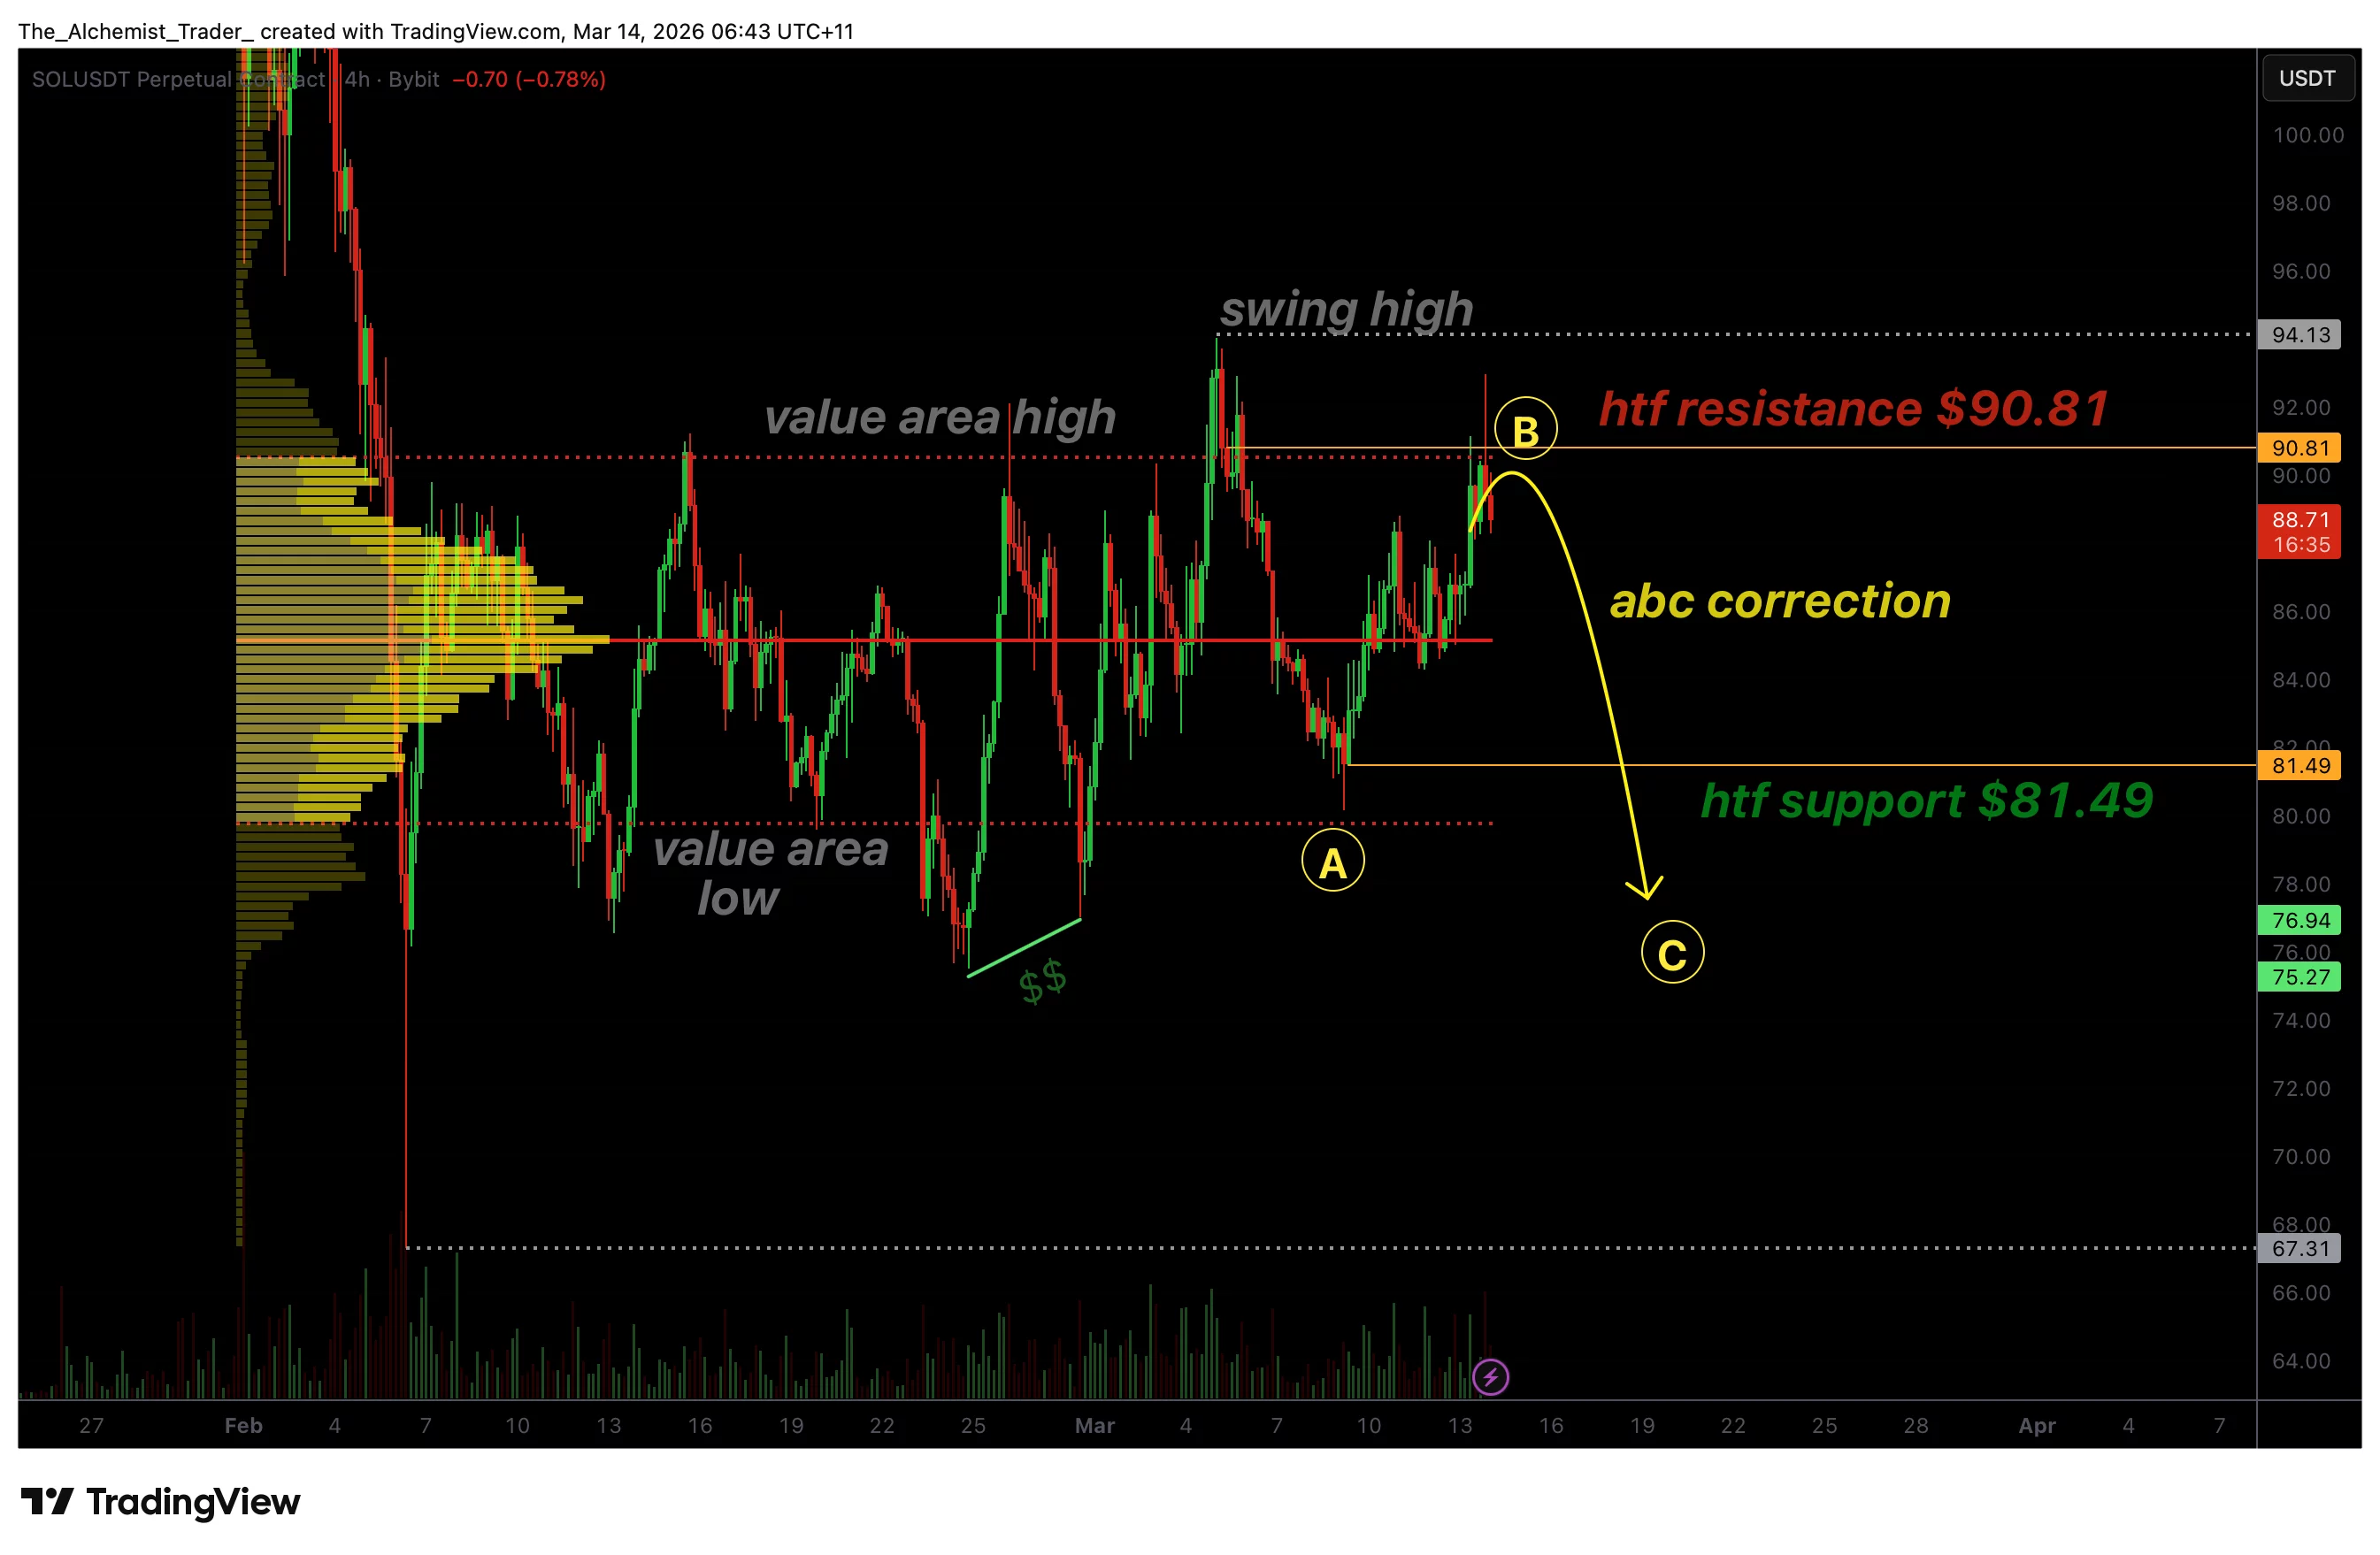
Solana’s price action recently approached the $90 region, which has historically acted as an important resistance level within the current market structure. This zone represents the upper boundary of the broader trading range and aligns closely with the value area high derived from the volume profile. When price approaches these areas, selling pressure often emerges as traders look to defend previous resistance.
The latest price movement shows a clear rejection from this region, reinforcing the idea that Solana remains within a corrective phase rather than entering a sustained breakout. The inability for price to reclaim the $90 resistance level suggests that buyers may be losing momentum at this point in the trend.
From a technical perspective, the rejection also aligns with a developing ABC corrective pattern, a common structure in market cycles where price moves through three phases before potentially resuming a broader trend. In this structure, the initial decline forms the A leg, followed by a temporary recovery known as the B leg, before the market enters the C leg, which typically extends toward lower liquidity zones.
In Solana’s case, the recent rally toward $90 may represent the B leg of the correction. Because the move has failed to sustain above resistance, the market may now be transitioning into the C leg of the structure, which typically involves price breaking below intermediate support levels as liquidity is cleared from the market.
This technical setup is unfolding as broader ecosystem developments continue, including Nasdaq-listed Solmate Infrastructure announcing plans to establish a Solana infrastructure hub in the United Arab Emirates as part of a wider corporate restructuring and capital overhaul.
One of the key levels to watch in this scenario is the $81 support zone, which represents an important high-timeframe support level within the current structure. If price moves below this level, it would confirm increasing bearish pressure and open the door for a deeper rotation toward the value area low.
The value area low acts as a key liquidity region where large clusters of orders tend to accumulate. In range-bound markets, price frequently rotates between the value area high and value area low as traders rebalance positions and search for liquidity.
Another important factor supporting the corrective outlook is the presence of untapped swing lows below the current price. Markets often move toward these zones as they contain resting stop orders and liquidity pools that larger participants may target before establishing a new directional move.
The confluence of resistance levels near $90 strengthens the probability that the rejection will continue to influence price direction. Multiple technical factors align in this region, including structural resistance, the value area high, and Fibonacci retracement levels, making it a significant barrier for bullish continuation.
Because of this, the broader market structure suggests that Solana may remain in a rotational environment until either the range high or range low is decisively broken. For now, the rejection from resistance suggests that the downside portion of the range may be tested next.
What to expect in the coming price action
As long as Solana remains below the $90 resistance zone, the ABC corrective structure is likely to remain active. A break below the $81 support level could accelerate downside momentum toward the value area low, while a strong reclaim of $90 would invalidate the bearish outlook and signal renewed bullish momentum.


