


Six consecutive weeks of Bitcoin ETF outflows news, the longest streak since spot funds launched in January 2024, have handed ammunition to a bear call that has since spread across social media. The number attached to it is stark: $23,979.
The catch is the condition required to get there, and that condition is what the data argues against.
The analytical spine of this article is straightforward: does the evidence behind the $23,979 Bitcoin price prediction actually hold up, or does it collapse under the weight of its own precondition?
EXCLUSIVE: Earn $10 USDC Via Binance Sign-Up
Jesse Olson’s Call and the Crash Condition It Requires
The prediction originates from analyst Jesse Olson, who posted on X on June 20, 2026. His framing was unambiguous: “$BTC reaching $23,979 was not on my 2026 bingo card. In my opinion, this only happens if the overall stock market crashes 50%+. I don’t believe Bitcoin goes to zero and I will be looking to buy the right dip whenever the reversal happens.”
$BTC reaching $23,979 was not on my 2026 bingo card.
In my opinion, this only happens if the overall stock market crashes 50%+. (still at all-time highs)
I don't believe Bitcoin goes to zero and I will be looking to buy the right dip whenever the reversal happens. pic.twitter.com/tFyZzmasMe
— Jesse Olson (@JesseOlson) June 20, 2026
That 50%-plus threshold is the key variable. A drawdown of that magnitude would rank alongside the 2008 financial crisis, not a standard cyclical correction. Bitcoin’s six-month S&P 500 correlation sits at 0.468, according to Charlie Quant Lab, a moderate positive reading where 1.0 would mean lockstep movement.
A severe equity selloff would pull Bitcoin down, but the linkage is not tight enough to guarantee a proportional collapse.
Morgan Stanley strategist Mike Wilson described recent market weakness as “ultimately healthy” and maintained an S&P 500 year-end target of 8,000, implying more than 8% upside from current levels.
S&P 500 earnings are still expected to grow in 2026, which removes the earnings-recession catalyst that deep crashes typically require. Benjamin Cowen sees the cycle bottom most likely around October 2026, not an imminent freefall. A BTC crash to the low $20,000s would need capitulation well beyond the norms of prior cycles.
DISCOVER: The Next 1000x Crypto Gem Before It Lists on Binance
Bitcoin ETF News: ETF Outflows Are Decelerating, Not Accelerating
The six-week outflow streak running through June 18, 2026, is real and record-setting – longer than the five-week streaks seen in early 2025 and early 2026. Total net outflows since mid-May reached approximately $4.68 billion, according to SoSoValue data cited by LCX. Yet the trend inside that streak tells a different story.
Weekly redemptions from the spot Bitcoin ETF complex peaked at $1.72 billion in the week of June 5, then fell to roughly $227 million by June 18, an 87% deceleration.
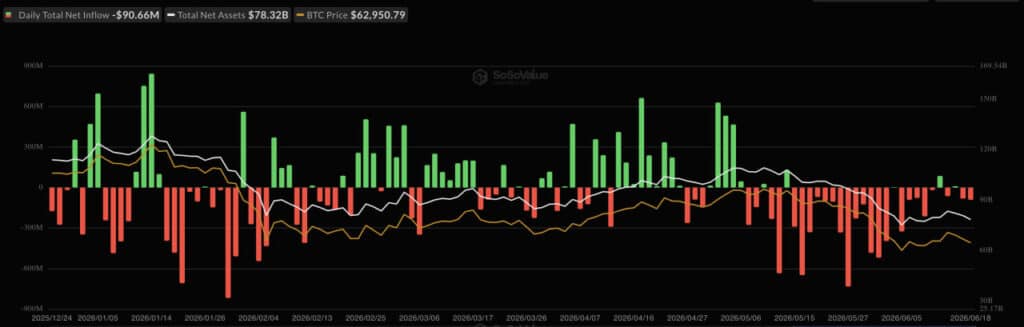
Altura DeFi COO Matthew Pinnock characterized the broader outflow episode as a “macro-driven repricing of risk” rather than a structural rejection of Bitcoin, emphasizing that shifting global risk sentiment, rates and geopolitics, drove institutional positioning more than any deterioration in Bitcoin’s long-term thesis.
Cumulative net flows into U.S. spot funds remain around $53.4 billion, down from a peak near $63 billion in October 2025, meaning the overwhelming majority of ETF capital is still in place. The scale of Bitcoin ETF assets under management provides a useful anchor here: outflows that represent less than 8% of cumulative inflows read as profit-taking, not an exodus.
DISCOVER: Best Meme Coin ICOs to Invest in 2026
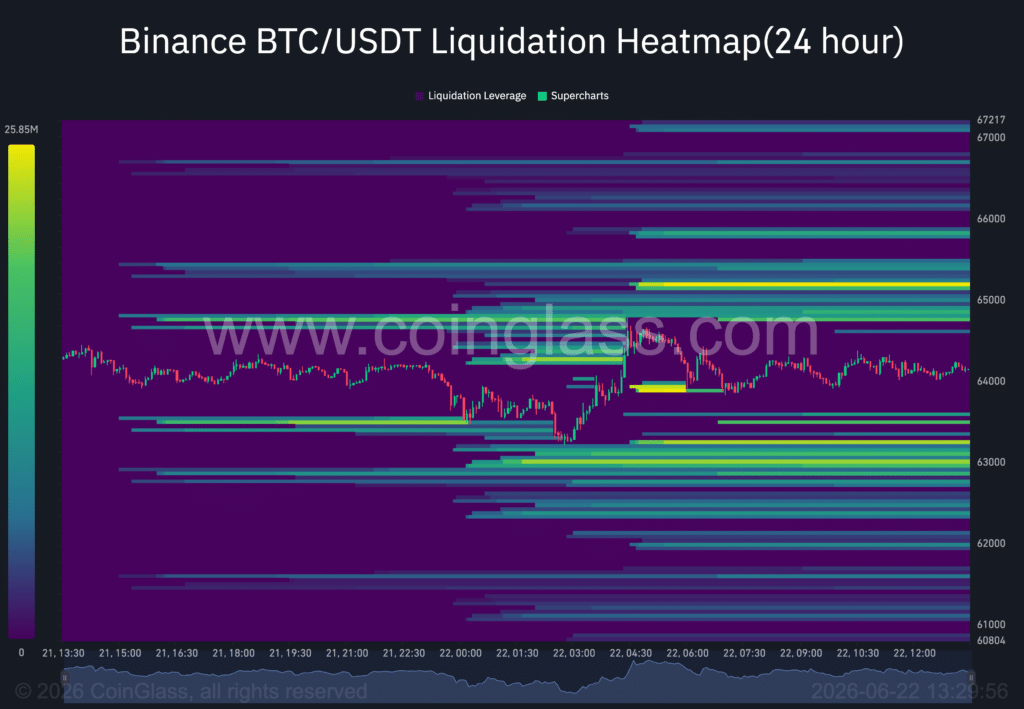
What the Liquidation Map and Long-Term Holders Are Saying
The Bitcoin liquidation map on Binance adds another layer of context. Long liquidation leverage sits near $2.41 billion while short liquidation leverage sits near $3.01 billion.
A liquidation map marks where leveraged positions would be forcibly closed at each price level, think of it as a pressure map of the derivatives market. The heavier forced-buy pressure sits above current price, which means a rally would squeeze shorts harder than a dip would squeeze longs.
The bigger mechanically forced move points upward.
The on-chain picture from long-term holders reinforces that read. Glassnode’s long-term holder net position change, which tracks whether wallets that have held Bitcoin for at least 155 days are adding or shedding coins, fell to a low of 30,885 BTC on June 11, then more than doubled to roughly 79,298 BTC by June 21.
These are the highest-conviction market participants, the ones who lived through prior cycles. They are buying the weakness, not running from it.
There is one short-term macro risk worth flagging. JPMorgan identified a potential $165 billion quarter-end stock market selloff as a near-term headwind. Given Bitcoin’s moderate equity correlation, that could deliver a meaningful short-term price hit. But a quarter-end rebalancing flow is a far cry from the 50%-plus crash that Olson’s $23,979 target requires.
EXPLORE: Best Crypto Presales With Asymmetric Upside in the Current Market
The post Why the $23,979 Bitcoin Crash Call Fails Its Own Precondition appeared first on 99Bitcoins.


