


XRP price has fallen toward $1.31 as daily momentum weakens, while analyst Ali Martinez sees a possible test of $1.25 before a rebound toward $1.42 or $1.60.
Summary
- XRP price traded near $1.318, with its weekly chart showing a decline of approximately 6.5%.
- Daily RSI stood at 36.84 as XRP traded near its lower Bollinger Band.
- Ali Martinez identified $1.25 as potential support, with conditional recovery targets of $1.42 and $1.60.
- CoinGlass showed prominent liquidation clusters above the market near $1.39 and $1.43.
TradingView’s Binance XRP/USDT charts placed the token around $1.317–$1.318 on Oct. 15, following a decline to $1.284. The weekly chart recorded a 6.54% loss, while the daily chart showed a 1.07% decline.
XRP’s retreat coincided with renewed attention to U.S. inflation. The Bureau of Labor Statistics reported that September consumer prices rose 3.7% from a year earlier, up from 3.4% in August, and increased 0.6% during the month.
XRP tests its lower Bollinger Band near $1.31
TradingView’s daily chart showed XRP trading just above its lower Bollinger Band at $1.3077 after briefly falling beneath it. The session’s $1.284 low marked the nearest downside reference, with the price subsequently recovering above $1.30.

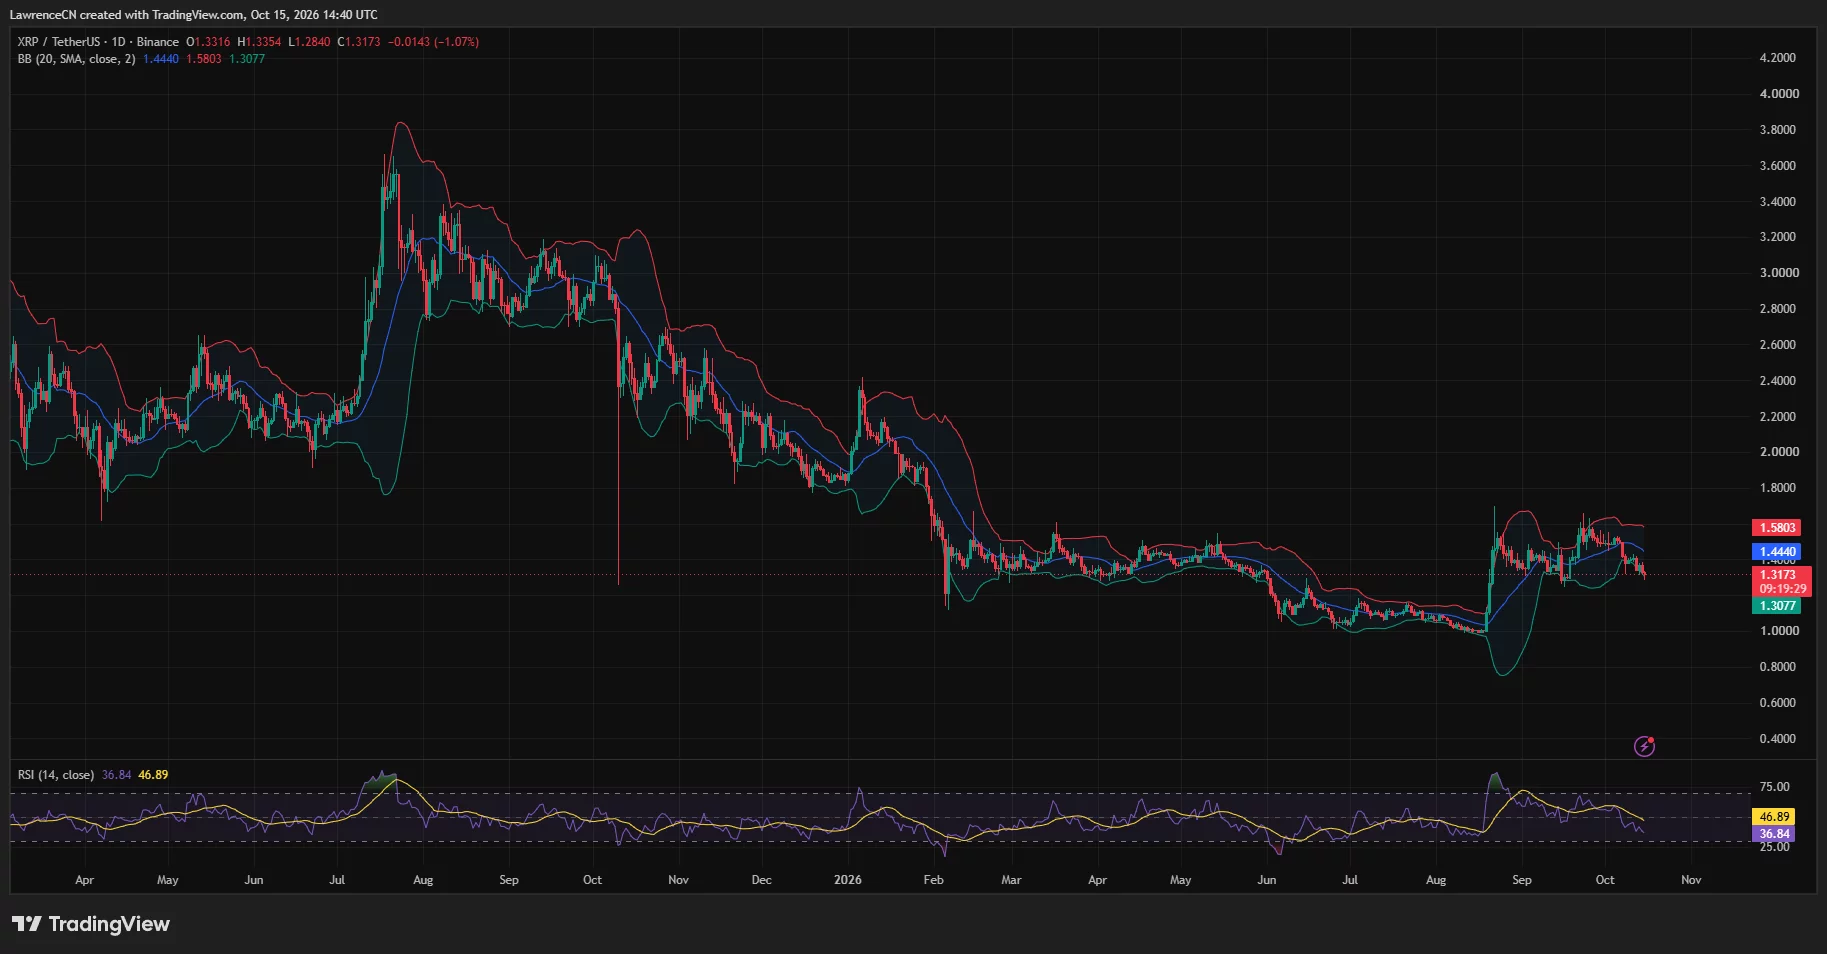
The same chart placed the middle Bollinger Band, which tracks the 20-day simple moving average, at $1.4440. XRP traded approximately 8.8% below that level, leaving a sizeable gap between its current price and the indicator’s central trend line.
The upper band stood at $1.5803. Together, the three readings placed XRP near the bottom of its daily volatility range after its late-September advance faded.
TradingView’s price history showed XRP climbing above $1.60 during that earlier advance before retreating through October. The latest decline returned the token toward the lower end of the range it had occupied before that rally.
Daily momentum also weakened. TradingView’s relative strength index stood at 36.84, below both the neutral 50 level and its displayed average of 46.89.
The RSI remained above the conventional oversold threshold of 30. Its position below its average accompanied the price decline, without yet showing a recovery above either reference level.
For the daily chart, the nearest upside checkpoints were therefore a sustained move away from $1.3077 and a recovery toward $1.4440. The upper Bollinger Band near $1.58 remained further above the market.
Martinez places a potential rebound zone at $1.25
Ali Martinez’s Oct. 15 analysis described XRP as trading within a parallel channel on the hourly chart. He said the price could fall toward the lower boundary around $1.25 before staging a meaningful rebound.
His first recovery target was the channel’s middle area near $1.42. A stronger rebound could extend toward the upper boundary around $1.60, according to his analysis.
From approximately $1.318, a decline to $1.25 would represent another 5.2% drop. A subsequent move from $1.25 to $1.42 would amount to a 13.6% rebound, while a rise from that support to $1.60 would equal 28%.
Martinez’s scenario depended on buyers responding near the lower channel boundary. His analysis presented $1.25 as a potential buying area rather than an established floor.
A separate Oct. 15 post from the analyst publishing as CW described XRP as showing a rebound near a buy wall. The accompanying order-book chart displayed a green buying zone below the recent trading range and several red selling zones overhead.
CW’s observation focused on a nearby buying response, while Martinez’s analysis allowed for another decline before a broader recovery. Both posts discussed potential rebounds within a market that remained below its recent highs.
Liquidation clusters build above XRP’s current price
CoinGlass’s one-week XRP liquidation heatmap showed the price falling from roughly $1.40 toward $1.31, with repeated declines interrupting short recoveries.

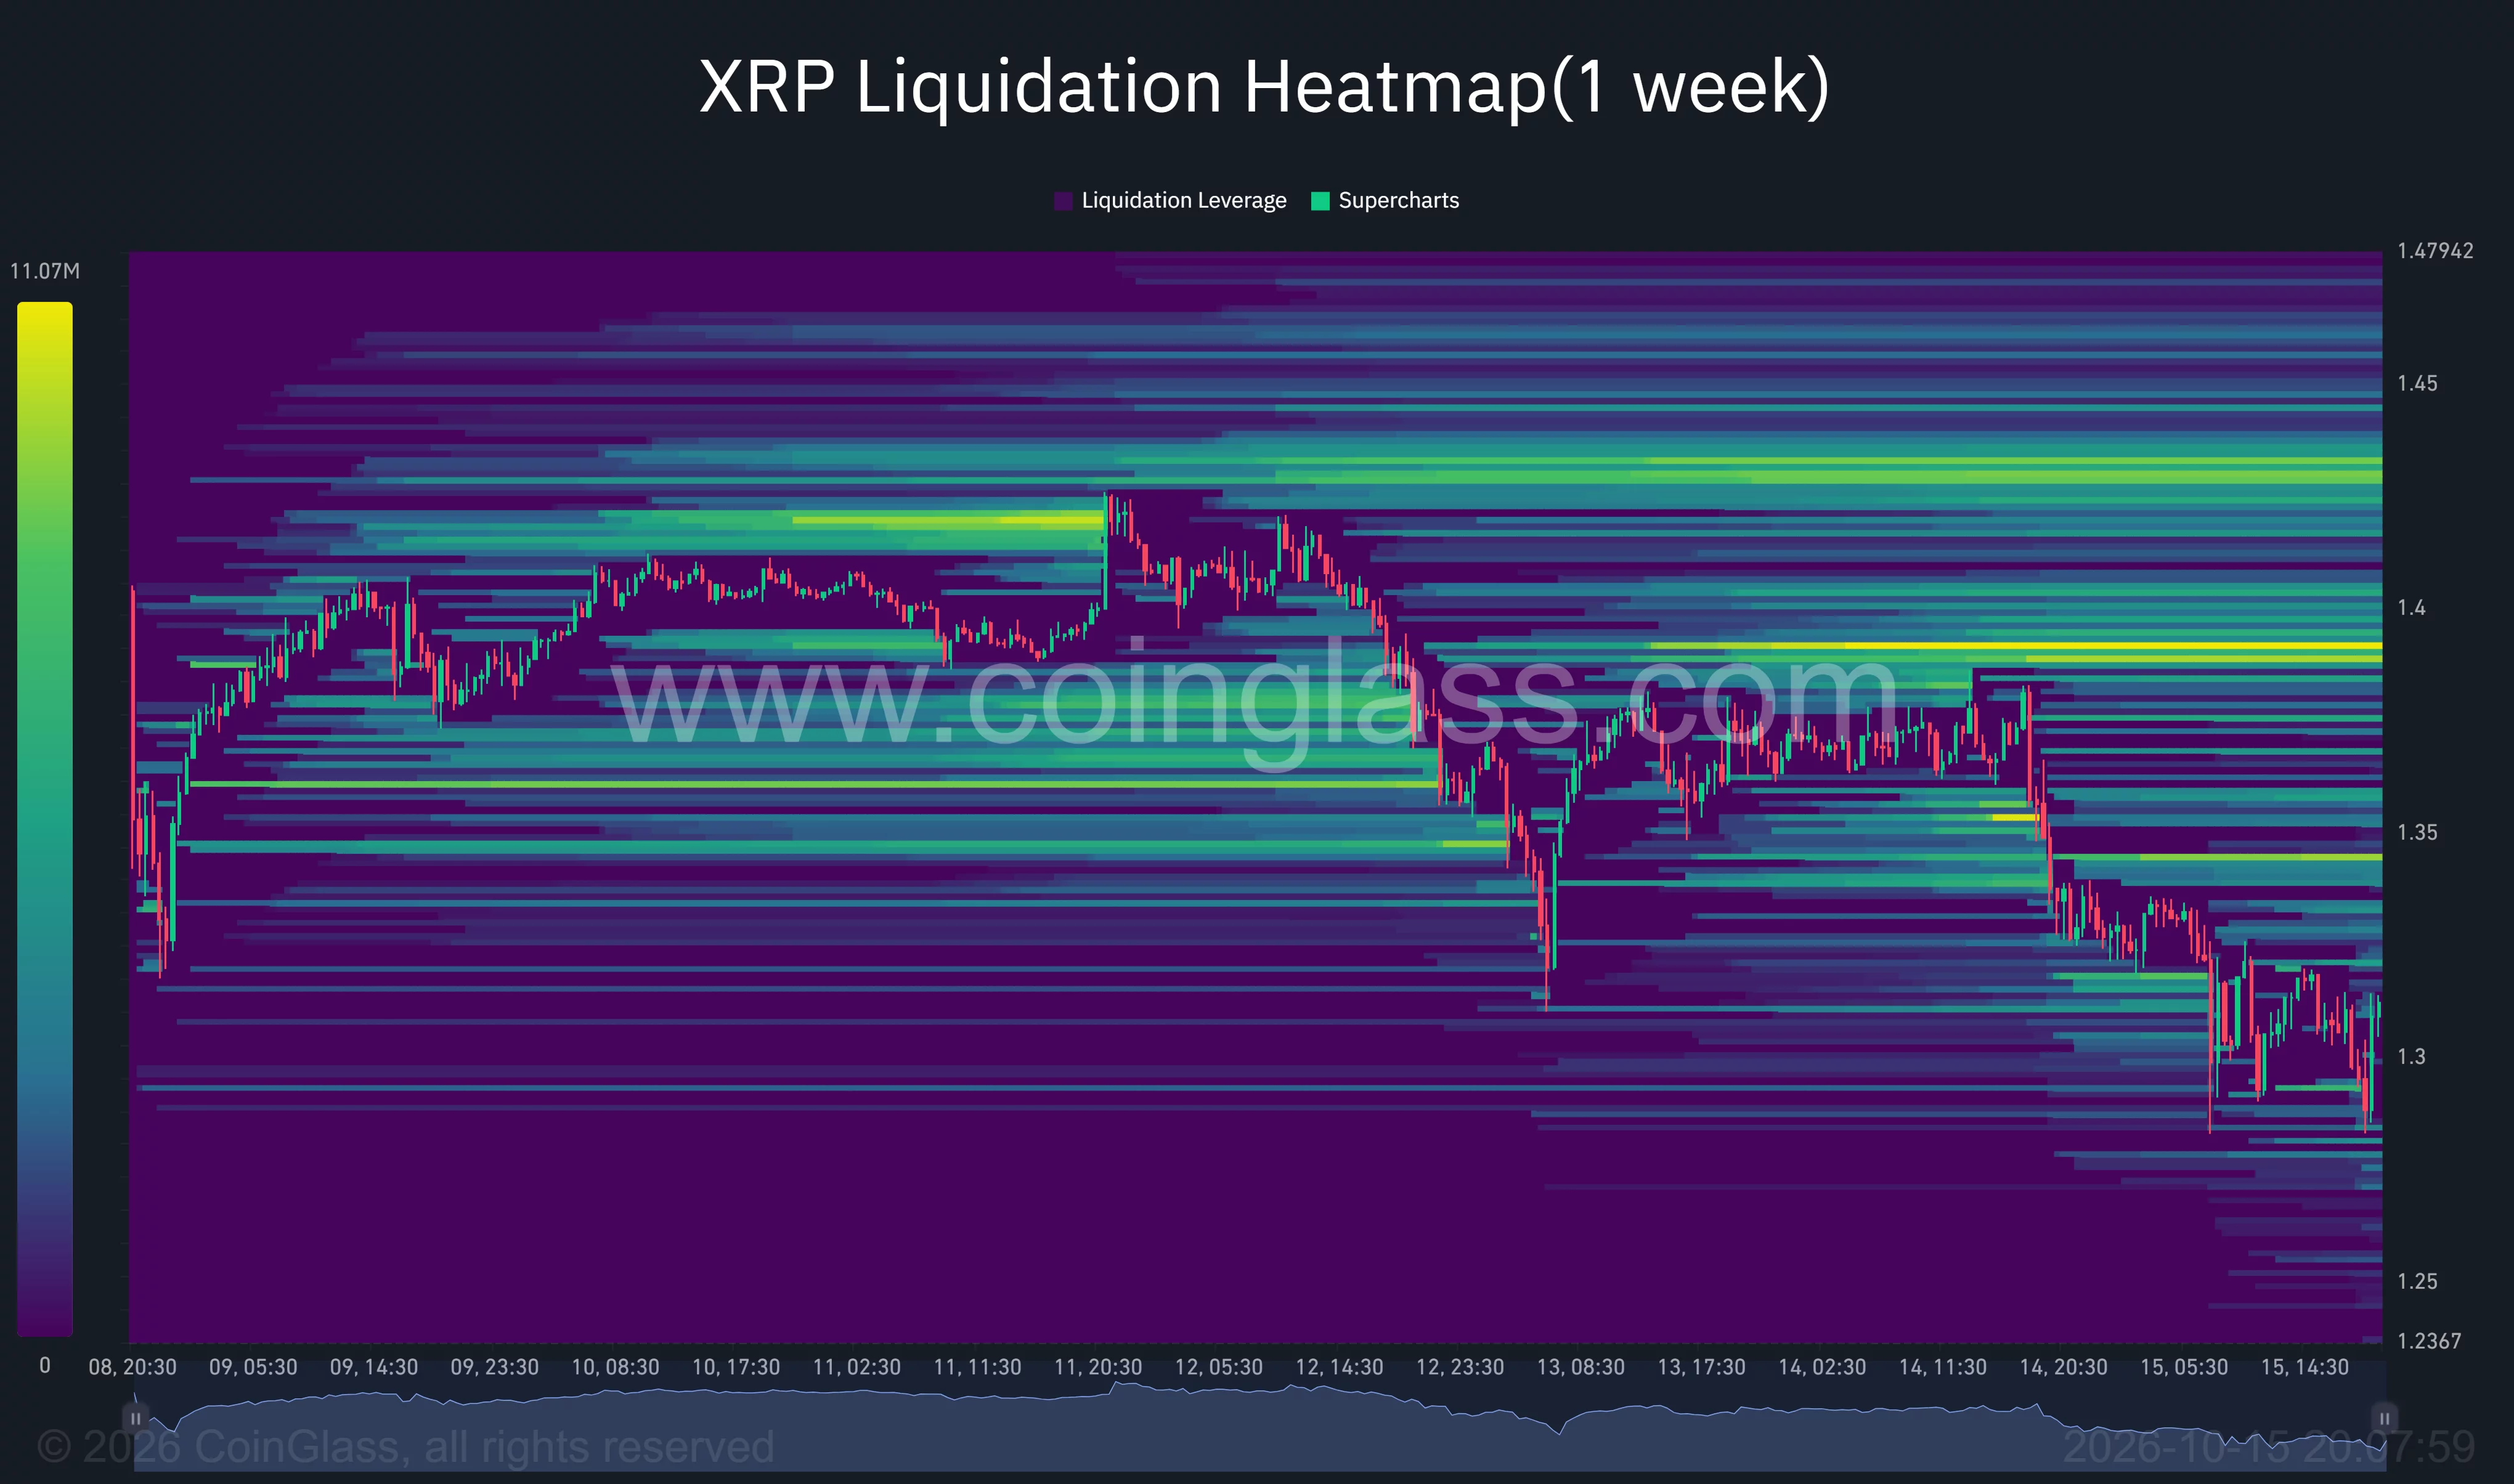
At the right edge of the heatmap, prominent overhead concentrations appeared around $1.39 and $1.43. Another visible band sat near $1.34–$1.35, closer to the latest price.
Those areas represented estimated liquidation exposure at different price levels. They were distinct from the resting buy and sell orders shown in CW’s order-book analysis.
Below the market, CoinGlass displayed several bands around $1.29–$1.30, followed by additional concentrations near $1.28. The latest price swings had already passed through parts of that lower region.
The heatmap’s overhead cluster around $1.39 sat below Martinez’s $1.42 midpoint target. The stronger concentration near $1.43 was also close to the daily Bollinger midpoint at $1.4440.
Across the three datasets, the $1.39–$1.44 region contained several separate reference points: estimated liquidation exposure, an analyst’s channel midpoint and the daily moving average.
Weekly chart leaves $1.17 below and $1.56 overhead
TradingView’s weekly Murrey Math indicator placed XRP between the $1.1719 lower trading-range level and the $1.5625 major support-and-resistance pivot.
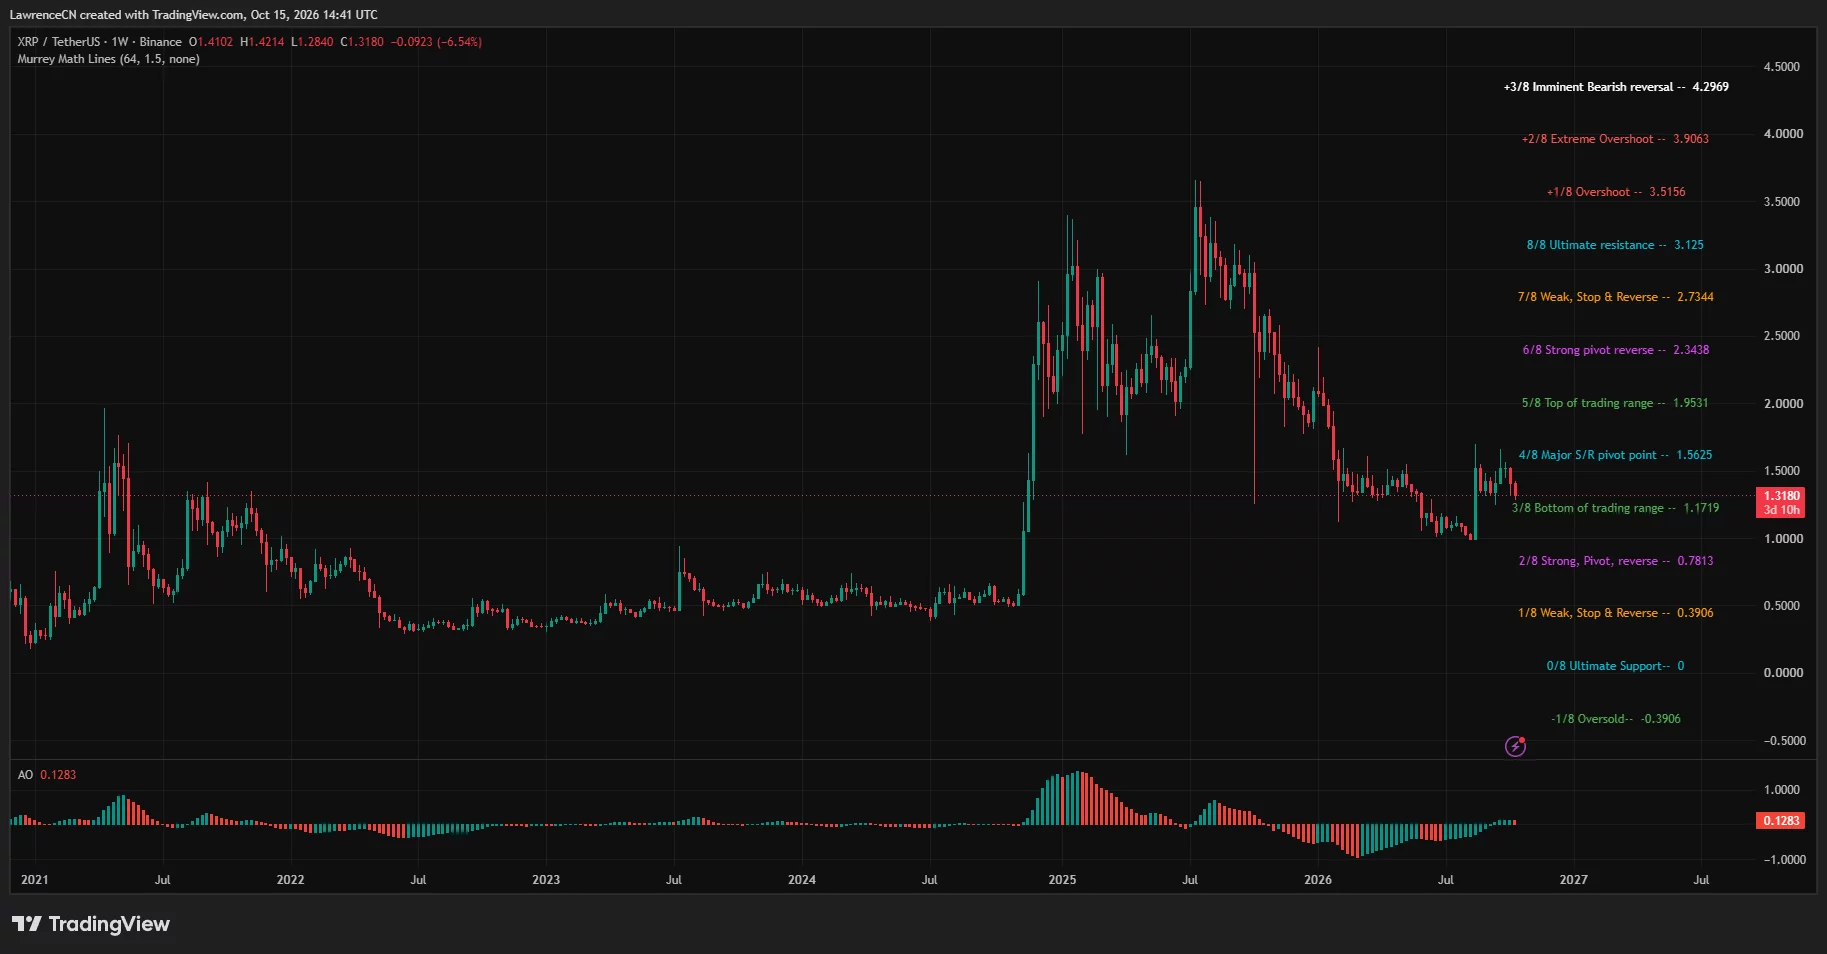
At approximately $1.318, XRP remained below that weekly pivot after its recent attempt to recover toward the $1.60 area. The chart’s next higher range marker stood at $1.9531.
On the downside, the weekly $1.1719 level sat below both the latest $1.284 low and Martinez’s proposed $1.25 support area. A move toward it would extend the decline beyond the hourly rebound setup he described.
The weekly Awesome Oscillator remained positive at 0.1283, although its latest histogram bar was red. The positive reading contrasted with the weaker daily RSI, showing that the two timeframes carried different momentum readings.
For XRP’s recovery scenario, Martinez identified $1.42 and $1.60 as conditional targets. TradingView placed the daily midpoint near $1.44 and the weekly pivot near $1.56, leaving several overhead levels between the current price and the top of his projected rebound range.
Disclosure: This article does not represent investment advice. The content and materials featured on this page are for educational purposes only.


